Custom chart overlay
You have already learned what chart overlay is and how to create it in a previous chapter (Chapter 6, Visualization). Now, we will see how to create custom chart overlay using a D3 extension. Basically, it is an advanced and more customized visualization option of chart overlay.
Example
Let's look at the tabular dataset that we will use to create custom chart overlay. Later, you will learn how to implement it in the Splunk dashboard.
The following screenshot is the subset of the total dataset that we will use to visualize custom chart overlay:
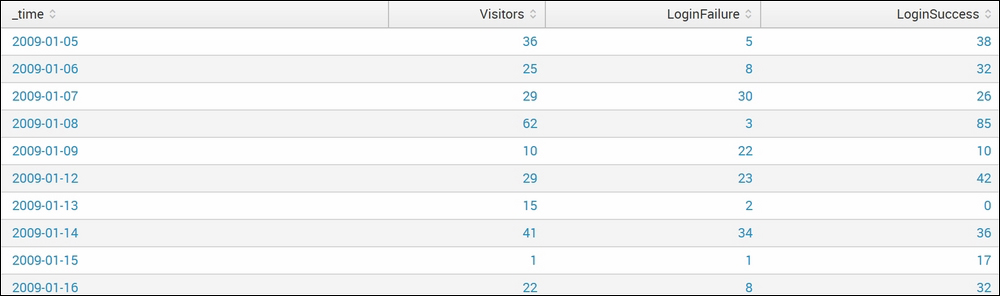
The preceding dataset that has login failure, login success, and number of visitors along ...
Get Advanced Splunk now with the O’Reilly learning platform.
O’Reilly members experience books, live events, courses curated by job role, and more from O’Reilly and nearly 200 top publishers.

