Chapter 8Local Correlation
Local correlation models are a recent cutting-edge development in derivatives modeling and extend the concept of local volatility to multiple assets. Indeed if the volatility of each asset is thought to depend on time and the spot price, then the same idea should probably apply to the correlation coefficient between any two assets. However there are theoretical and practical issues: on the theoretical side the entire correlation matrix must remain positive-definite, which can be challenging; and on the practical side there are very few observable basket option prices to calibrate to. In this chapter we give evidence of non-constant implied correlation and introduce a model that is consistent with this behavior.
8.1 The Implied Correlation Smile and Its Consequences
Just as there is an implied volatility smile for options on single stocks, there is also an implied volatility smile for basket options, which is best observed on index options. Figure 8.1 compares the six-month smile on the EuroStoxx 50 index versus the average six-month smile on its constituents. We can see that the slope of the index smile is different from the slope of the constituents' smile, a phenomenon that may only be reproduced by having a different correlation parameter for each moneyness level.
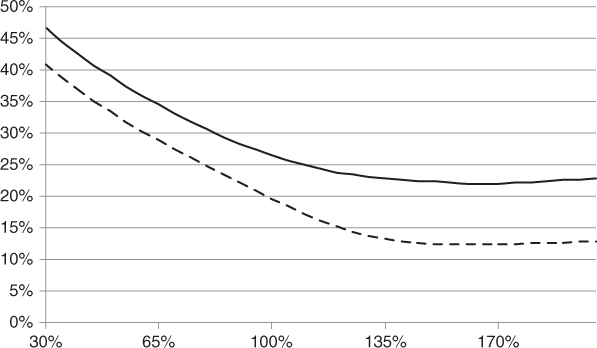
Figure 8.1 Six-month smile on the Dow Jones EuroStoxx 50 index versus the average ...
Get Advanced Equity Derivatives: Volatility and Correlation now with the O’Reilly learning platform.
O’Reilly members experience books, live events, courses curated by job role, and more from O’Reilly and nearly 200 top publishers.

