Chapter 6Introducing Correlation
Correlation is almost as ubiquitous as volatility in quantitative finance. For example the downward-sloping volatility smile observed in equities may be explained by the negative correlation between stock prices and volatility. In this chapter we introduce various measures of correlation between assets, investigate their properties, and present simple multiasset extensions of the Black-Scholes and Local Volatility models.
6.1 Measuring Correlation
Correlation is the degree to which two quantities are linearly associated. A correlation of +1 or −1 means that the linear relationship is perfect, while a correlation of 0 typically1 indicates independence.
There are two kinds of correlation between two financial assets:
- Historical correlation, based on historical returns;
- Implied correlation, derived from option prices.
6.1.1 Historical Correlation
Historical correlation between two assets S(1) and S(2) is usually measured as the Pearson's correlation coefficient between their N historical returns observed at regular intervals:
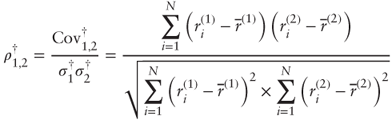
where Cov†1,2 is historical covariance, σ†'s are historical standard deviations, ![]() is the return on asset S(j) for observation i, and is the mean return on asset S(j). Returns may be computed on an arithmetic or logarithmic ...
is the return on asset S(j) for observation i, and is the mean return on asset S(j). Returns may be computed on an arithmetic or logarithmic ...
Get Advanced Equity Derivatives: Volatility and Correlation now with the O’Reilly learning platform.
O’Reilly members experience books, live events, courses curated by job role, and more from O’Reilly and nearly 200 top publishers.

