Chapter 2The Implied Volatility Surface
Despite its flaws and limitations, the Black-Scholes model became the benchmark to interpret option prices. Specifically, option prices are reverse-engineered to calculate implied volatilities, the same way that bond prices are transformed into yields, which are easier to understand. This process, combined with interpolation and extrapolation techniques, gives rise to an entire surface along the strike and maturity dimensions.
2.1 The Implied Volatility Smile and Its Consequences
The Black-Scholes model assumes a single constant volatility parameter to price options. In practice, however, every listed vanilla option has a different implied volatility ![]() (K, T) for each strike K and maturity T. Figure 2.1 shows what an implied volatility surface
(K, T) for each strike K and maturity T. Figure 2.1 shows what an implied volatility surface ![]() looks like.
looks like.
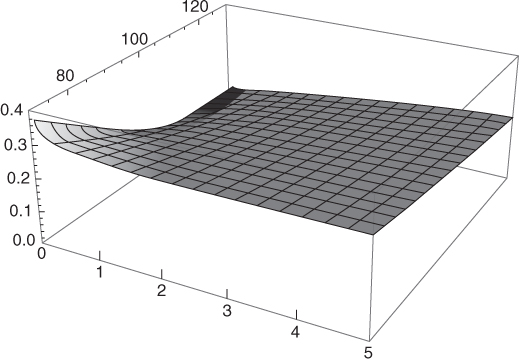
Figure 2.1 Implied volatility surface of the S&P 500 as of July 18, 2012. Strikes are in percentage of the spot level.
For a fixed maturity T the curve ![]() is called the implied volatility smile or skew and exhibits a downward-sloping shape, as shown in Figure 2.2. Note that in other asset ...
is called the implied volatility smile or skew and exhibits a downward-sloping shape, as shown in Figure 2.2. Note that in other asset ...
Get Advanced Equity Derivatives: Volatility and Correlation now with the O’Reilly learning platform.
O’Reilly members experience books, live events, courses curated by job role, and more from O’Reilly and nearly 200 top publishers.

