CHAPTER 5
Bollinger Bands, PSAR, Channels, Zones, and FTL
The Bollinger band (BB) is another very important technical indicator. It is represented by the red lines on the chart in Figure 5.1. The bands are plotted at two standard deviations above and below M2 (green). When using two standard deviations, we know that 95 percent of the price data (the line chart of the stock) will fall between the two Bollinger bands. In this chapter we study in greater detail how the line chart will travel between the Bollinger bands and M1 (white) and why this is a vital indicator to increase our profits.
FIGURE 5.1 Chart of FULT—UBB, LBB
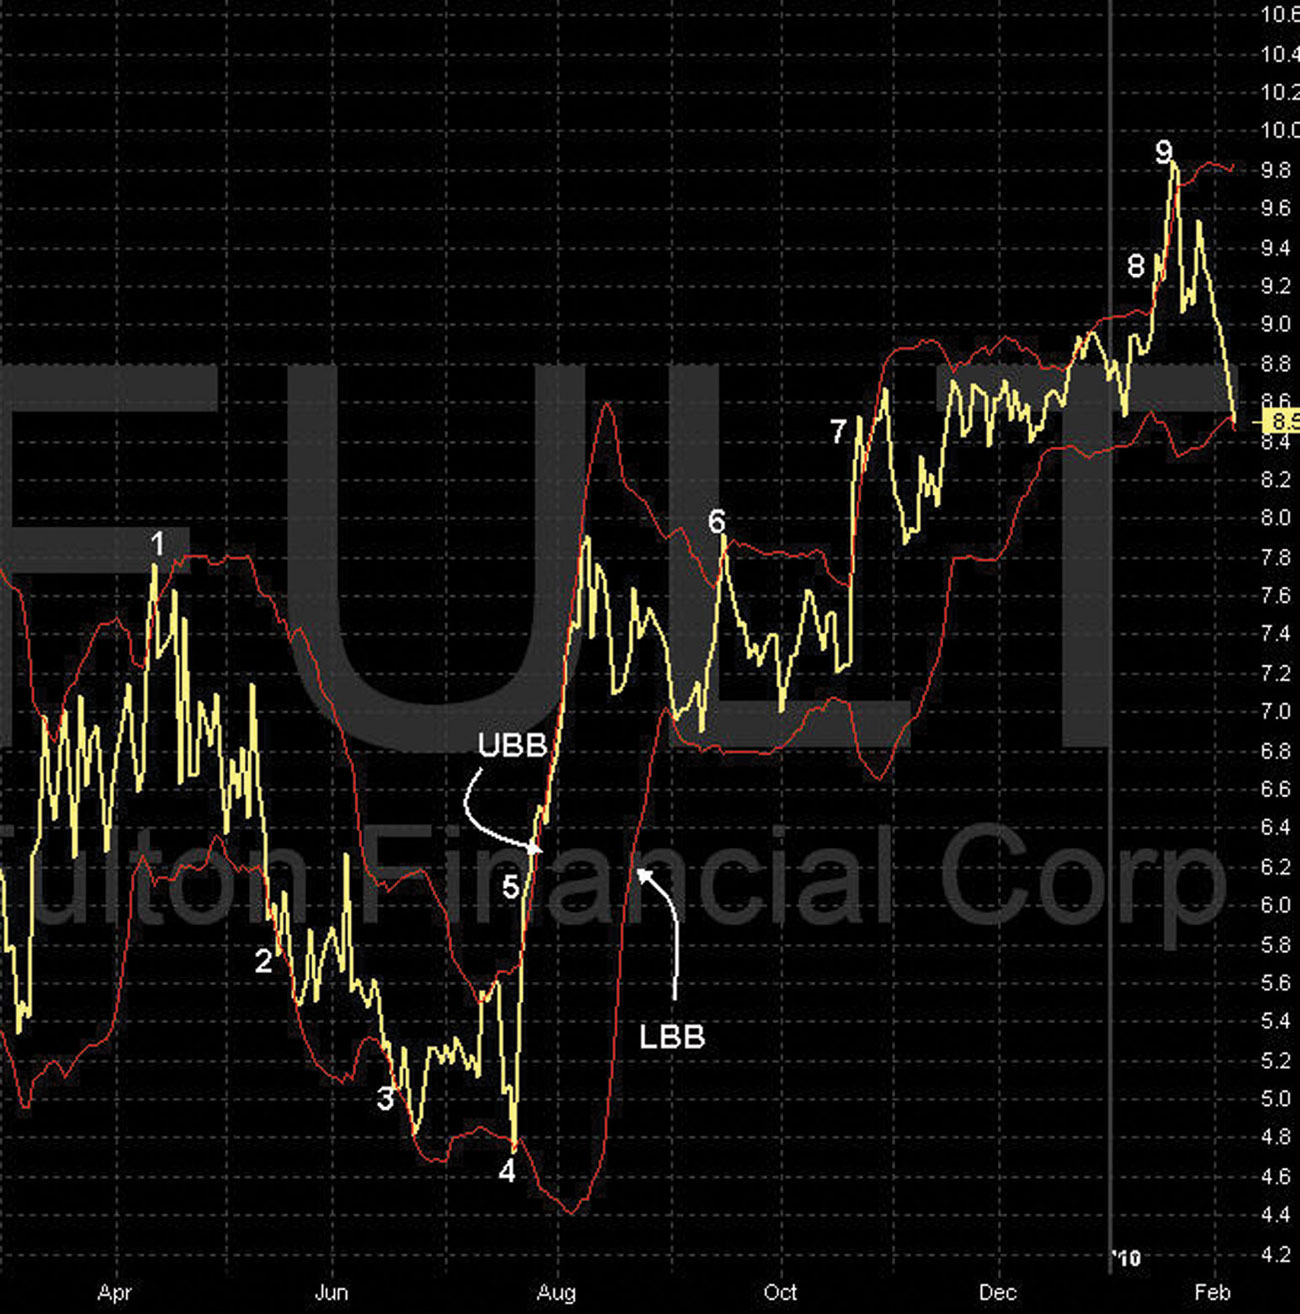
In Figure 5.1, the upper red line is called the upper ...
Get Advanced Charting Techniques for High Probability Trading: The Most Accurate And Predictive Charting Method Ever Created now with the O’Reilly learning platform.
O’Reilly members experience books, live events, courses curated by job role, and more from O’Reilly and nearly 200 top publishers.

