CHAPTER 3
Direction of a Trend
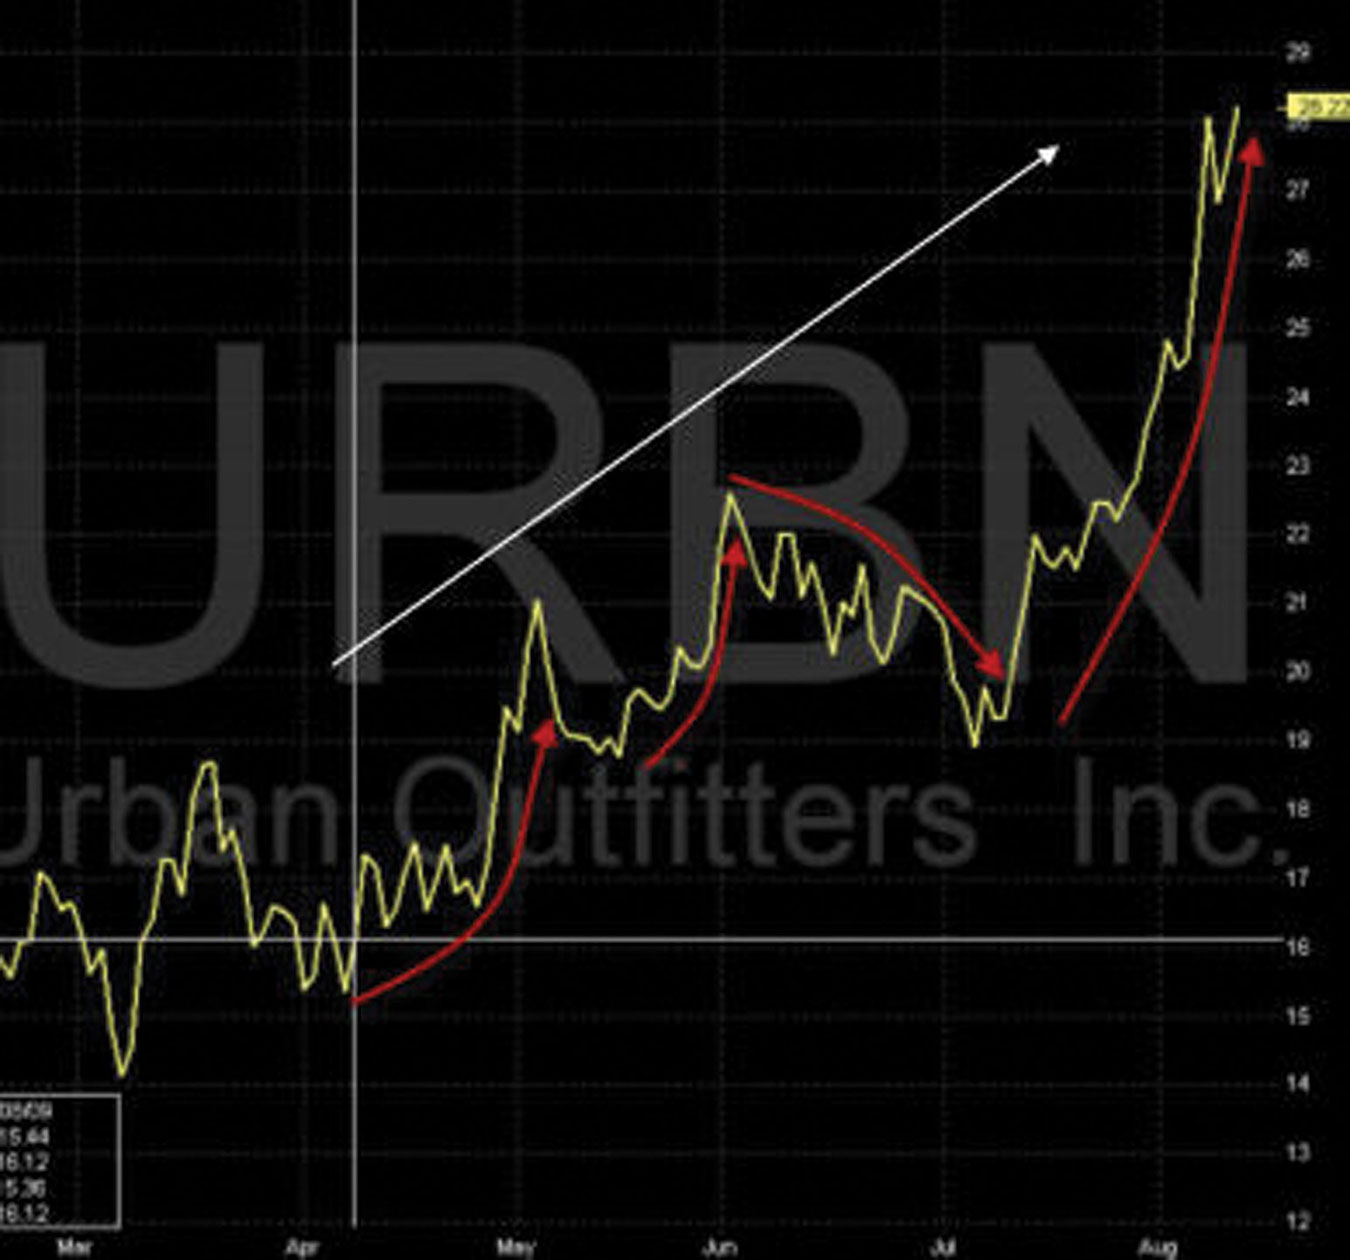
One of the basics of understanding any technical charting program is to understand cycles and trends. It is critical to understand how repeating cycles define, direct, and bend a trend line. A series of repeating upward-moving cycles, where the high of the cycle is higher than the previous cycle, ultimately defines a trend line. The trend line will begin to angle upward.
When the cycles begin to change where the higher highs are now lower than the previous high and the lower lows are now lower than the previous low, the trend line will begin to change its direction. The URBN chart shown in Figure 3.1 illustrates how repeating cycles define a trend line.
FIGURE 3.1 URBN—Cycles and Trends

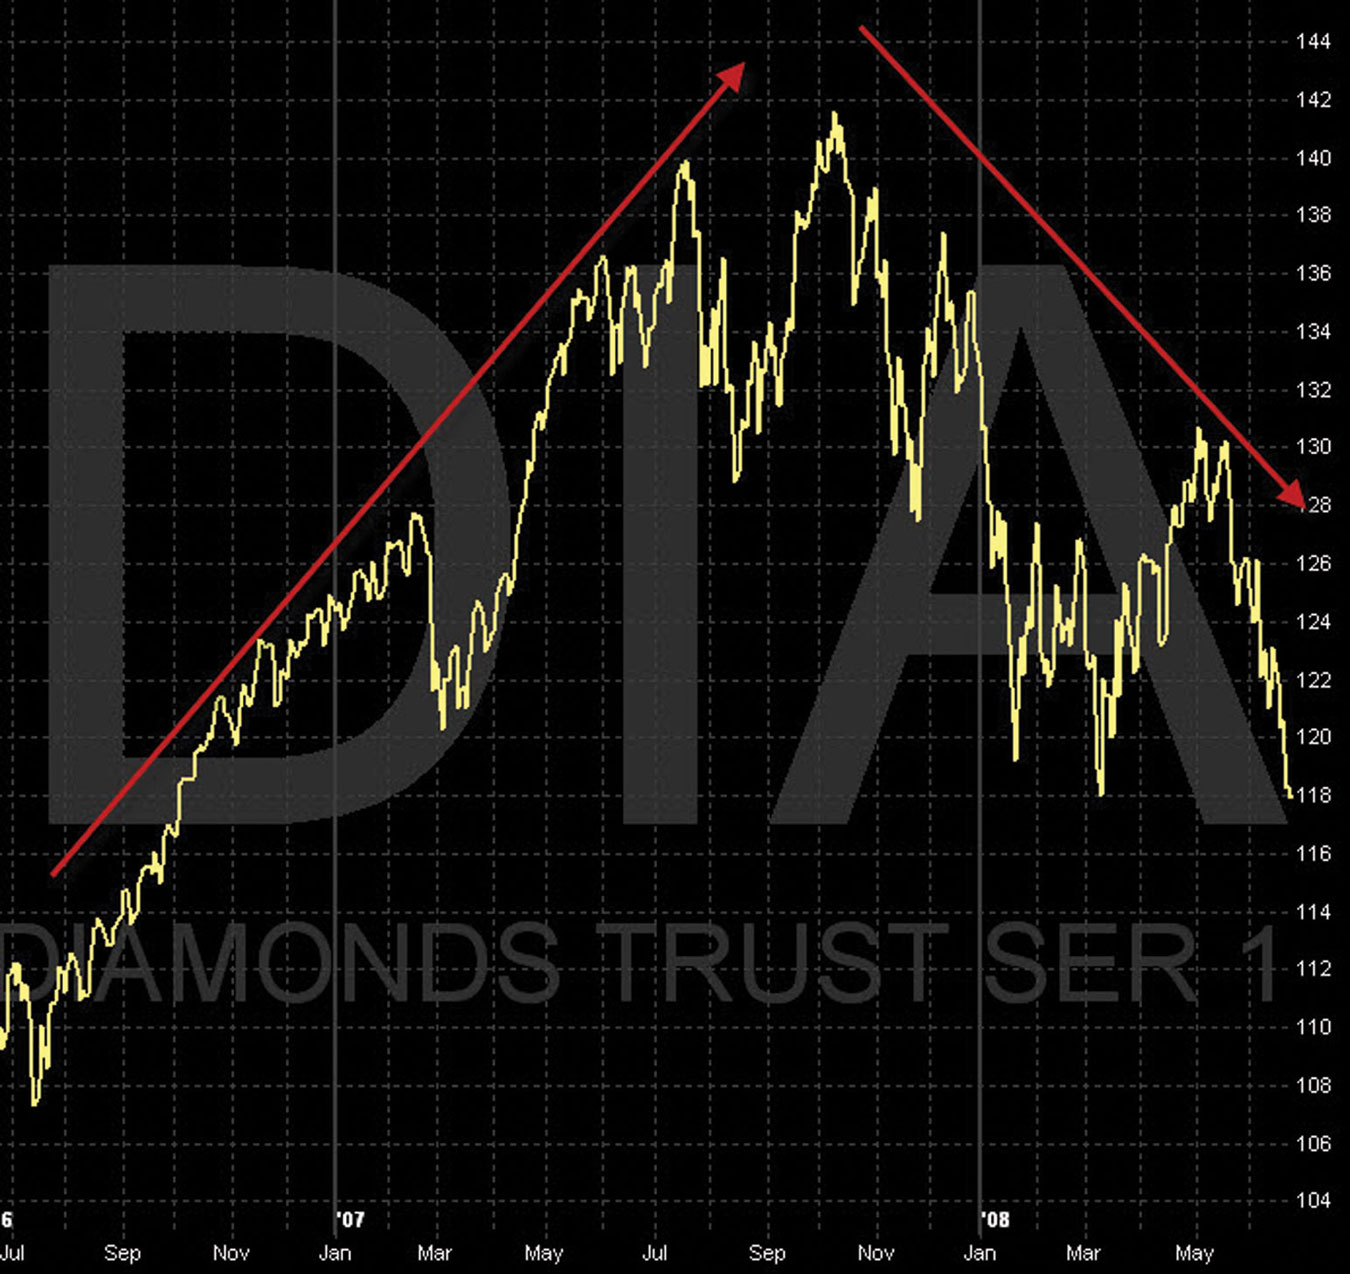
The two-year view of the DIA chart in Figure 3.2 shows how repeating cycles will change the trend of the stock. It is important to note that within each of the cycles of this two-year chart, there are numerous cycles and trends occurring. Advanced Charting is all about identifying these cycles relative to their trends.
FIGURE 3.2 DIA—Cycles and Trends

■ Four Phases of a Cycle
Advanced Charting allows traders to look into the future with a higher degree of probability to determine the four phases of a cycle, which are:
Get Advanced Charting Techniques for High Probability Trading: The Most Accurate And Predictive Charting Method Ever Created now with the O’Reilly learning platform.
O’Reilly members experience books, live events, courses curated by job role, and more from O’Reilly and nearly 200 top publishers.

