Chapter 4 Visualization
Key Points and Questions
- With the foundation of strategic questions and data, what should we be visualizing?
- How should we be visualizing it?
- Is there a methodology that works?
- How can we continue to move fast, make a difference, and create believers of actionable intelligence?
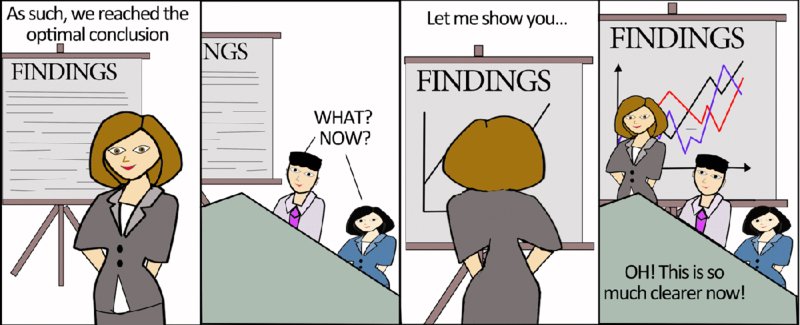
SOURCE: Lee Min Lau.
Now that you know how to get the data straight and how to visualize that data to arrive at answers, it is time to start building from there. Answering one strategic business question with the aid of great visualizations does not make you a hero instantly. So it is time to move on, increase the effort, and learn from your mistakes to make every new piece of actionable intelligence better, easier, and more visually appealing than the last one.
That is the importance of visualization. You can have important data all cleaned up, full, and complete. If nobody sees it, it has as much added value as an empty bag.
If the data is accurate and timely, as we saw in Chapter 3, then you can unlock its dormant value by making it accessible. Do this by—you guessed it—visualizing the data. Now, the definition of cutting-edge visualization changes every year. What is hip and modern today looks hopelessly outdated tomorrow. That's the reason you will not find images of visualizations in this chapter. Instead, you will find examples of how visualizations develop. And more ...
Get Actionable Intelligence: A Guide to Delivering Business Results with Big Data Fast! now with the O’Reilly learning platform.
O’Reilly members experience books, live events, courses curated by job role, and more from O’Reilly and nearly 200 top publishers.

