DOCUMENTING PROCESSES AND SYSTEMS (STUDY OBJECTIVE 9)
Systems professionals and accountants must understand the documentation and charts that describe accounting systems. Such documentation allows the accountant to analyze and understand the procedures and processes of a business process and the systems that capture and record accounting data. The old adage that a picture is worth a thousand words is true for users documenting processes and systems. A picture, or chart, of the system is a concise, complete, and easy-to-understand way to analyze a process or system. The various types of popular pictorial representations of processes and systems used in businesses today include the following:
- Process maps
- System flowcharts
- Document flowcharts
- Data flow diagrams
- Entity relationship diagrams (ER diagrams)
PROCESS MAPS
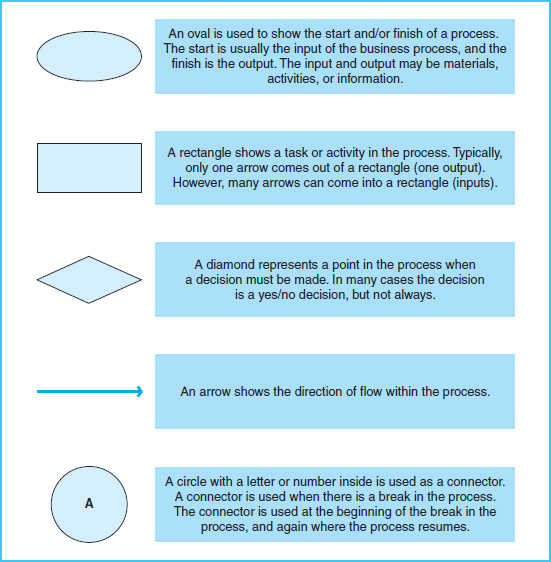
Process maps are pictorial representations of business processes in which the actual flow and sequence of events in the process are presented in diagram form—the start of a process, the steps within the process, and a finish of the process. Process maps are becoming a popular way to represent business processes, particularly as organizations undergo business process reengineering. Five symbols are used in process maps, as shown in Exhibit 2-6.
Exhibit 2-6 Process Map Symbols
With these five symbols, any business process can be depicted. Exhibit 2-7 is a sample process ...
Get Accounting Information Systems: The Processes and Controls, 2nd Edition now with the O’Reilly learning platform.
O’Reilly members experience books, live events, courses curated by job role, and more from O’Reilly and nearly 200 top publishers.

