Hack #45. Summarize Complex Data
Take advantage of Crosstab queries to get a view on multifaceted data.
When you need to aggregate data that has more than a simple grouping structure,
Crosstabs are the way to go. "Create Conditional Subtotals"
[Hack #29]
shows you how to use groups and conditional summing on a report. That works as long as the conditions don't lead to an overwhelming number of possibilities.
The example in that hack uses five states and two years on which to create subtotals. The data model, though, has another table in play: a table of pets (the model is a simulation of a veterinary practice). This creates a large number of possibilities, such as all cat visits in New York in 2003, or all dog visits in Pennsylvania in 2004, and so on. Figure 5-21 shows the updated data model for this hack.
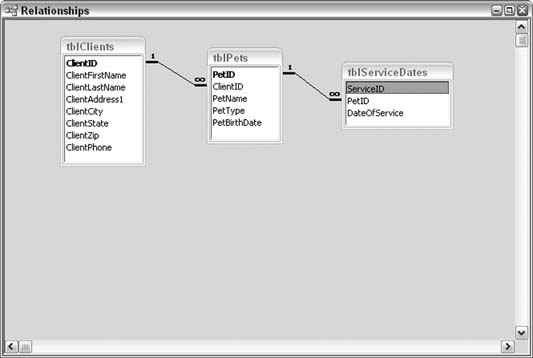
Figure 5-21. The pets data model
The data model includes seven types of pets (bird, cat, dog, ferret, horse, monkey, and snake), five states (CT, MA, NJ, NY, and PA), and two years of data (2003 and 2004). This makes 70 possible combinations. The best way to sum up the number of visits in which all these combinations of criteria are mixed and matched is to use a Crosstab query.
To get started, we must put together a Select query to join the different tables and return the fields needed in the Crosstab. Note that the Select query has a calculated field that isolates the year ...
Get Access Hacks now with the O’Reilly learning platform.
O’Reilly members experience books, live events, courses curated by job role, and more from O’Reilly and nearly 200 top publishers.

