7
CONSTRUCTING ENGINEERING TABLES AND GRAPHICS
Too often writers overlook the importance of including graphics in their reports and papers. Correctly done, graphics (or visuals) not only are informative, but they also draw the readers’ attention to information writers choose to highlight…. And if one definite trend is emerging in writing about high-tech subjects, it is an increasing reliance on visual communication.
Charles Sides, How to Write and Present Technical Information, 3rd ed. (Phoenix: Oryx Press, 1999), p. 48.
When you write engineering documents, you're likely to need tables, illustrations, diagrams, charts, graphs, drawings, and schematics. Nontextual material like this helps present your information more effectively and gives a polished, professional look to your work. With the increasing power and ease of use of graphics software applications, you don't need to be a graphics professional to create or adapt graphics for your engineering documents.
TABLES
You've probably constructed tables using word-processing applications such as Open-Office Write, WordPerfect, or Word. This section provides some ideas for increasing your productivity with tables and for fine-tuning the design of tables. (See Figure 7-1 for table terminology.)
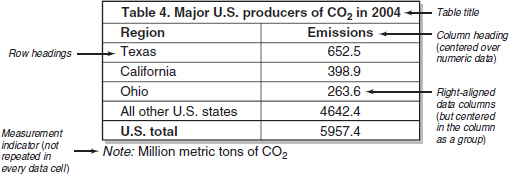
Figure 7-1 Table terminology. You might prefer a table design with fewer grid lines. Check your word-processing software; it provides many ...
Get A Guide to Writing as an Engineer, 4th Edition now with the O’Reilly learning platform.
O’Reilly members experience books, live events, courses curated by job role, and more from O’Reilly and nearly 200 top publishers.

