NPlot is a flexible and simple-to-use open source charting library for the .NET Framework v2.0. NPlot’s ability to quickly create charts makes it an ideal tool for data inspection, debugging, or analysis purposes. The library’s flexibility also makes it a great choice for creating carefully tuned charts for publications or as part of your application’s interface.
Tool | NPlot |
Version covered | 0.9.9.3 |
Home page | |
Power Tools page | |
Summary | A charting library for .NET 2.0 with a simple, flexible API |
License type | Custom (effectively, a choice of GPL-compatible or BSD with an advertising clause) |
Online resources | Wiki |
Supported Frameworks | .NET 2.0 |
Related tools in this book | WebChart |

NPlot requires version 2.0 of the .NET Framework. You must also agree to the terms of its license. The license is very relaxed on the use of NPlot in other open source software or software written for personal use, but use of NPlot in a closed-source application requires that you advertise NPlot’s role in your application’s About box or documentation.
You can download the NPlot library from the Download Area link on the tool’s home page. NPlot is distributed in a .zip file that contains the assembly, complete C# source to the library, and a C# demo showing the library in action.
To create a chart, the first thing you need to do is construct an instance of a PlotSurface2D class. The role of this object is to coordinate the display of the axes, title, and legend, as well as all the data-dependent elements of the chart. NPlot provides three such classes:
Windows.PlotSurface2DA Windows Forms control that implements plotting functionality and enables management of a user’s interaction with the chart.
Bitmap.PlotSurface2DA Windows Forms control that allows you to easily draw charts on a
System.Drawing.Bitmapobject. This class is often used in web applications to generate dynamic charts and is also useful in debugging.Web.PlotSurface2DAn ASP.NET control that implements the
IPlotSurface2Dfunctionality. The implementation of this control compromises performance, and its use is not recommended.
A PlotSurface2D class that allows charts to be used in GTK# applications created with Mono (the free C# compiler/.NET implementation) under Linux has also been written for an older version of NPlot. This class is not currently maintained as part of the library, but it might be in the future.
Once you’ve created a PlotSurface2D, you’re ready to start charting some data. To do this, you first need to create an instance of one of NPlot’s classes that implements the IDrawable or IPlot interface. You then point this object to your data, optionally set a few display properties, and add it to your PlotSurface2D.
Plot classes wrap your data and provide functionality for drawing it against a pair of axes. The different plot classes display your data in different ways (for example, as a series of points or as a line). Plot classes can also draw representations of themselves in a plot surface legend if one is present and can suggest the axes against which they should optimally be drawn.
Several lightweight classes, including TextItem and ArrowItem, implement just the IDrawable interface. These classes can’t draw representations of themselves in the legend or influence the PlotSurface2D’s selection of axes.
The most commonly used classes implementing IDrawable are:
ArrowItemDraws arrows pointing to a particular world coordinate
FilledRegionCreates a filled area between two line plots
GridAdds gridlines that automatically align to axis tick positions
TextItemPlaces text at a specific world coordinate
The following are descriptions of some of NPlot’s available plot types:
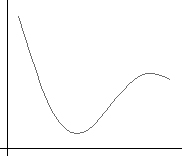
LinePlotUse a line plot (Figure 4-16) when it makes sense to connect successive data points. For example, you would use a line plot to graph measurements of the ambient temperature of a room at various times throughout a day. You can control the line in the plot by passing a configured
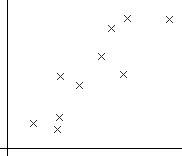
System.Drawing.Penclass to theLinePlot.PointPlotUse a point plot (scatter chart) when it does not make sense to connect successive data points. For example, if you wanted to visualize the heights and weights of a group of people on a chart, you could plot a point for each person with the x-position determined by the person’s weight and the y-position determined by the person’s height. Fifteen predefined marker styles, including the one shown in Figure 4-17, are available.
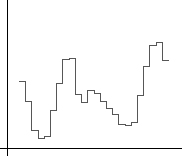
StepPlotStep plots like the one in Figure 4-18 are useful for displaying sample-based data (such as PCM audio), where each value can be thought of as representing the value of the measured quantity over a specific time period. You can choose whether the horizontal sections of the step plot are centered on the abscissa values or drawn between successive abscissa values.
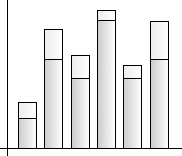
BarPlotA bar plot (or histogram) is usually used to chart the number of data values belonging to one or more categories. The height of the bar represents the number of values in the given category. For example, if you had a collection of dogs and data on the breed of each, you could create a chart of the number of each type of breed.
You will often want to make the x-axis a
LabelAxis(the names of the dog breeds, for instance). You can define fill patterns for the bars usingHorizontal-RectangleBrushand similar classes. Bar charts can also be stacked on top of each other, as shown in Figure 4-19. Horizontal bar plots are currently not supported by NPlot.ImagePlotImage plots (Figure 4-20) are often used to display the variation of a value over a spatial area. Each value in the region is mapped to a color. You can specify the color-to-value mapping using an object of any class that implements
IGradient, such asLinearGradient.
If the built-in IPlot and IDrawable classes don’t provide the functionality you require, creating your own class that implements one of these interfaces is straightforward. This is perhaps the most common way of extending NPlot.
You can add as many plots to a PlotSurface2D object as you like. The order in which they are drawn is configured with the z-order parameter of the Add( ) method. Also, the PlotSurface2D classes define two independent x-axes and two independent y-axes. When you add an item, you can choose the x- and y-axes you would like it to be associated with.
The IPlot interface does not enforce how data associated with the specific plot classes should be represented. However, where it makes sense, these classes provide a consistent interface for this purpose. Data can be provided in one of two forms:
In an object of type
DataSet,DataTable, orDataViewfrom theSystem.DatanamespaceIn any collection that implements the
IEnumerableinterface where it is valid to cast each of the elements to typedouble
Examples of such collections are:
Double[]System.Collections.ArrayListSystem.Collections.Generic.List<System.Int16>
If you are working with very large data sets and efficiency is a concern, it is best to pass your data to NPlot via the built-in array type double[].
The following four properties are used to specify data:
DataSourceThe
DataSet,DataTable, orDataViewobject you are using.DataMemberA string containing the name of the source
DataTablein aDataSet.AbscissaDataThe x-coordinates of the data to plot. This should be a string containing the name of the column to take the data from if the source is a
DataTableorDataView. Otherwise, it can be set to any container that implements theIEnumerableinterface. This property is optional. If it is not specified (or is set tonull), the abscissa data will be assumed to be 0, 1, 2....OrdinateDataThe y-coordinates of the data to plot. This should be a string containing the name of the column to take the data from if data is being read from a
DataTableorDataView. Otherwise, it can be set to any container that implements theIEnumerableinterface.
If these properties are not suitable for a particular plot type, the interface is as close to this as possible. For example, CandlePlot provides OpenData, LowData, HighData, and CloseData properties instead of OrdinateData.
A PlotSurface2D object automatically determines axes suitable for displaying the plot objects that you add to it. However, these are highly customizable. Some common things that you might wish to add or adjust are:
A label for the axis (using the
Labelproperty)Tick text/label fonts (using the
TickTextFontandLabelFontproperties)The angle of the text next to the ticks (using the
TicksAngleproperty)The pen used to draw the axis (using the
AxisPenproperty)World minimum and maximum values (using the
WorldMinandWorldMaxproperties)
You can also replace the default axes with a completely different axis type. NPlot provides a number of axis types with individually configurable characteristics, including LinearAxis, LogAxis, LabelAxis, and DateTimeAxis.
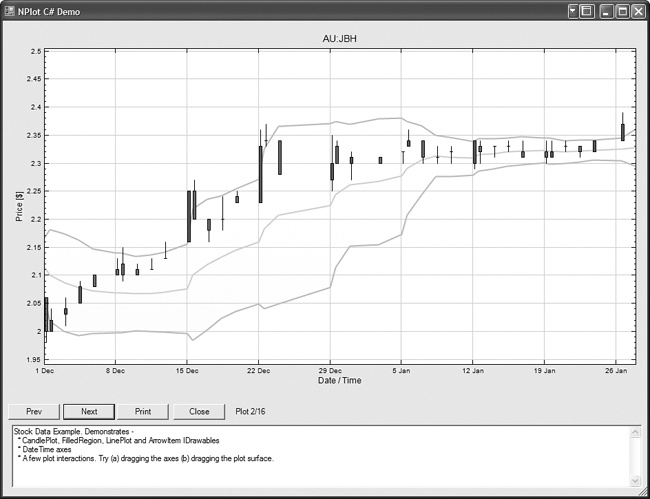
NPlot’s distribution includes a nice demo application that runs through many of NPlot’s chart types. The application demonstrates just how easy it is to feed data sources into a plot object and produce a detailed graph. Example 4-3 shows extracts from the demo app for creating a CandlePlot graph showing stock price data.
Example 4-3. Creating a CandlePlot from an XML file
// The plot surface to hold graphs. Note the surface is an
//    NPlot.Windows.PlotSurface2D class instead of
//    NPlot.PlotSurface2D. The utilized class derives from
//    Forms.UserControl and automatically paints itself.
private NPlot.Windows.PlotSurface2D plotSurface;
// obtain stock information from XML file
DataSet ds = new DataSet( );
System.IO.Stream file =
Assembly.GetExecutingAssembly( ).GetManifestResourceStream(
        "NPlotDemo.resources.asx_jbh.xml" );
ds.ReadXml( file, System.Data.XmlReadMode.ReadSchema );
DataTable dt = ds.Tables[0];

// create CandlePlot
CandlePlot cp = new CandlePlot( );
cp.DataSource = dt;
cp.AbscissaData = "Date";
cp.OpenData = "Open";
cp.LowData = "Low";
cp.HighData = "High";
cp.CloseData = "Close";
cp.BearishColor = Color.Red;
cp.BullishColor = Color.Green;
cp.StickWidth = 3;
cp.Color = Color.DarkBlue;

plotSurface.Add( new Grid( ) );
plotSurface.Add( cp );

plotSurface.Title = "AU:JBH";
plotSurface.XAxis1.Label = "Date / Time";
plotSurface.YAxis1.Label = "Price [$]";

plotSurface.Refresh( );
An input record from the XML data file looks like this:
<asx_jbh>
    <ID>1270061</ID>
    <CompanyID>800</CompanyID>
    <Date>2003-10-23T00:00:00.0000000+10:00</Date>
    <Open>2.2</Open>
    <Low>2.15</Low>
    <High>2.27</High>
    <Close>2.25</Close>
    <Volume>28859100</Volume>
    <AdjClose>2.25</AdjClose>
</asx_jbh>
Figure 4-21 shows the graph produced by this code and data.
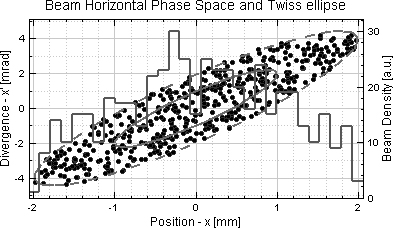
NPlot offers great flexibility for combining plot types, too. Figure 4-22 shows the power of NPlot by layering multiple y-axes, a dashed-line plot, and a histogram plot.
Get Windows Developer Power Tools now with the O’Reilly learning platform.
O’Reilly members experience books, live events, courses curated by job role, and more from O’Reilly and nearly 200 top publishers.

