Correlation with Change Management and Incident Timelines
Changing production systems brings risk. Keeping track of when the last change was made to your production environment is invaluable when tracking down a site degradation or outage, even just to eliminate (or include) the code push as a cause of the issue. At Flickr, we always found it helpful to have the timestamp of the last code deploy right in the header of our metrics pages (see Figure 3-4).

Figure 3-4. Putting a timestamp of the last code deploy in the Ganglia header
This meant we could quickly line up any issues that we saw on the graphs below the header with the last known code deploy.
In another example by Mike Brittain, he graphed the number of minutes since the last code push with Munin (see Figure 3-5). This makes lining up a code push to any resultant effects on the infrastructure easy once he can line up this graph against CPU, network, or any other metric he's gathering.
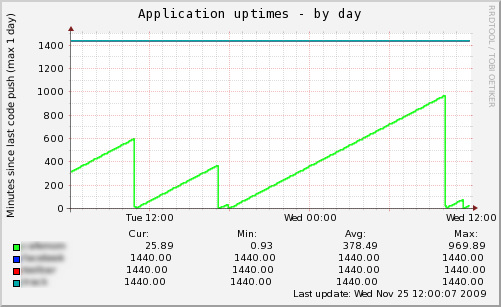
Figure 3-5. Graphing the time since the last code push
Get Web Operations now with the O’Reilly learning platform.
O’Reilly members experience books, live events, courses curated by job role, and more from O’Reilly and nearly 200 top publishers.

