Chapter 5. Understanding Data
Once you’ve got your data, what do you do with it? What should you look for? What tools should you use? This section opens with some ideas on improving your data literacy, tips for working with numbers and statistics, and things to bear in mind while working with messy, imperfect and often undocumented datasets. We go on to learn about how to get stories from data, data journalists’ tools of choice, and how to use data visualization to give you insights into the topic you’re looking at.
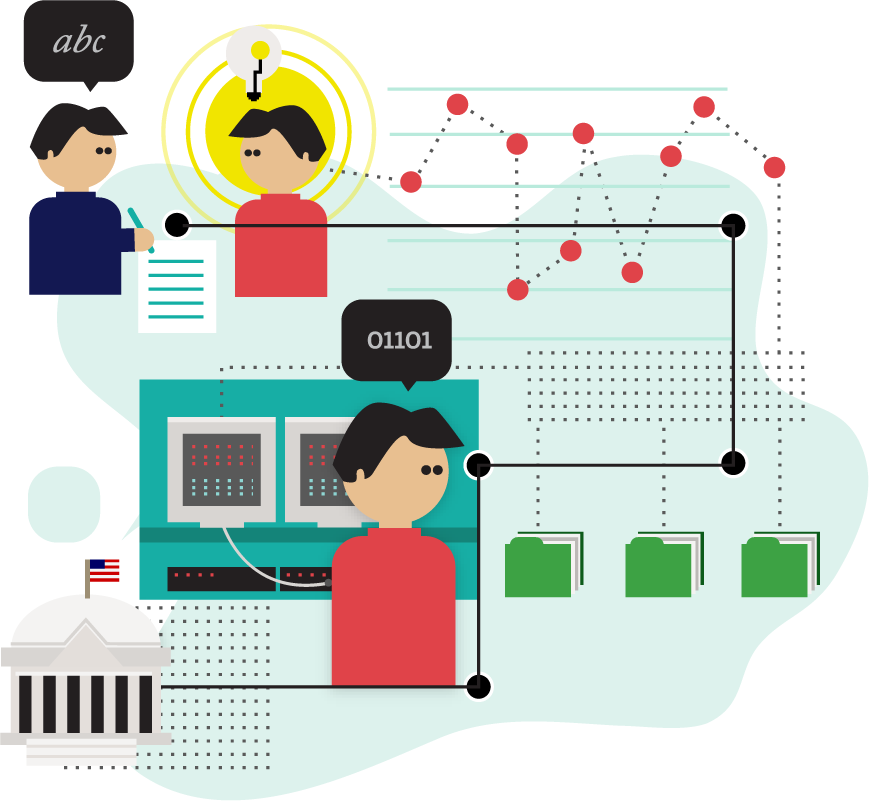
Become Data Literate in Three Simple Steps
Just as literacy refers to “the ability to read for knowledge, write coherently, and think critically about printed material,” data-literacy is the ability to consume for knowledge, produce coherently, and think critically about data. Data literacy includes statistical literacy, but also understanding how to work with large datasets, how they were produced, how to connect various datasets, and how to interpret them.

Figure 5-1. Digging into data (photo by JDHancock, http://www.flickr.com/photos/jdhancock/3386035827/)
Poynter’s News University offers math classes for journalists, in which reporters get help with concepts such as percentage changes and averages. Interestingly enough, these concepts are being taught simultaneously near ...
Get The Data Journalism Handbook now with the O’Reilly learning platform.
O’Reilly members experience books, live events, courses curated by job role, and more from O’Reilly and nearly 200 top publishers.

