Chapter 3. Case Studies
In this section we take a more in-depth, behind-the-scenes look at several data journalism projects—from apps developed in a day to nine-month investigations. We learn about how data sources have been used to augment and improve coverage of everything from elections to spending, riots to corruption, the performance of schools to the price of water. As well as larger media organizations such as the BBC, the Chicago Tribune, the Guardian, the Financial Times, Helsingin Sanomat, La Nación, Wall Street Journal, and the Zeit Online, we learn from smaller initiatives such as California Watch, Hack/HackersBuenos Aires, ProPublica, and a group of local Brazilian citizen-journalists called Friends of Januária.
The Opportunity Gap
The Opportunity Gap used never-before-released U.S. Department of Education civil rights data and showed that some states, like Florida, have levelled the field and offer rich and poor students roughly equal access to high-level courses, while other states, like Kansas, Maryland, and Oklahoma, offer less opportunity in districts with poorer families.
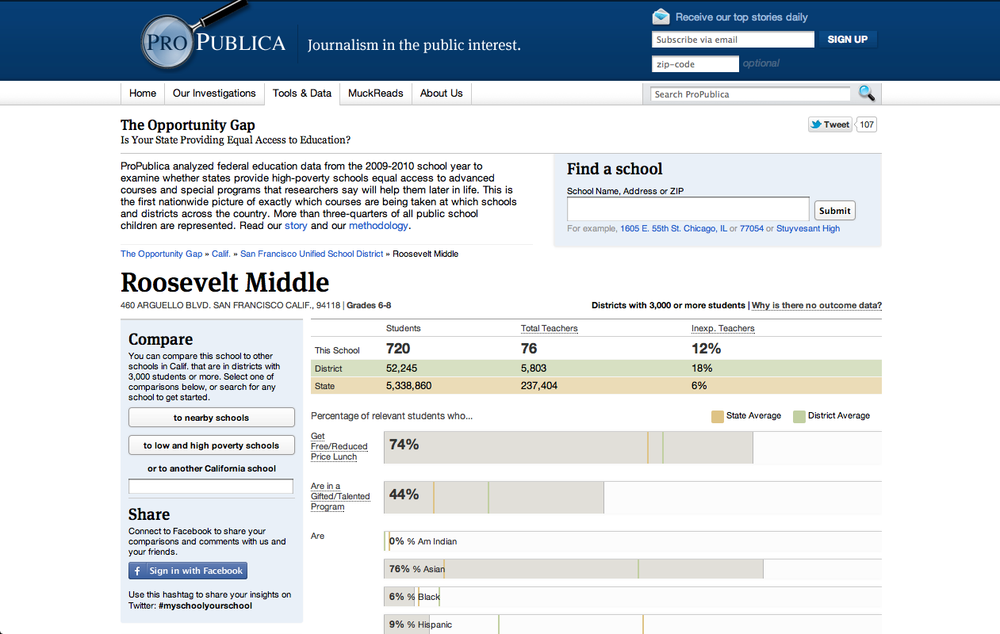
Figure 3-1. The Opportunity Gap project (ProPublica)
The data included every public school in a district with 3,000 students or more. More than three-quarters of all public-school children were represented. ...
Get The Data Journalism Handbook now with the O’Reilly learning platform.
O’Reilly members experience books, live events, courses curated by job role, and more from O’Reilly and nearly 200 top publishers.

