SVG, which stands for Scalable Vector Graphics, is an application of XML that makes it possible to represent graphic information in a compact, portable form. Interest in SVG is growing rapidly. Most modern web browsers can display SVG graphics, and most vector drawing software programs can export SVG graphics. This chapter begins with a description of the two major systems of computer graphics, and describes where SVG fits into the graphics world. The chapter concludes with a brief example that uses many of the concepts that you will explore in detail in the following chapters.
The two major systems for representing graphic information on computers are raster and vector graphics.
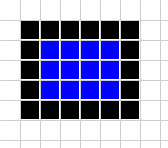
In raster graphics, an image is represented as a rectangular array of picture elements or pixels (see Figure 1-1). Each pixel is represented either by its RGB color values or as an index into a list of colors. This series of pixels, also called a bitmap, is often stored in a compressed format. Because most modern display devices are also raster devices, displaying an image requires a viewer program to do little more than uncompress the bitmap and transfer it to the screen.
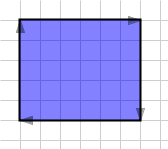
In a vector graphics system, an image is described as a series of geometric shapes (see Figure 1-2). Rather than receiving a finished set of pixels, a vector viewing program receives commands to draw shapes at specified sets of coordinates.
If you think of producing an image on graph paper, raster graphics work by describing which squares should be filled in with which colors. Vector graphics work by describing the grid points at which lines or curves are to be drawn. Some people describe vector graphics as a set of instructions for a drawing, while bitmap graphics (rasters) are points of color in specific places. Vector graphics “understand” what they are—a square “knows” it’s a square, and text “knows” that it’s text. Because they are objects rather than a series of pixels, vector objects can change their shape and color, whereas bitmap graphics cannot. Also, all text is searchable because it really is text, no matter how it looks or how it is rotated or transformed.
Another way to think of raster graphics is as paint on canvas, while vector graphics are lines and shapes made of a stretchable material that can be moved around on a background.
Raster graphics are most appropriate for use with photographs, which are rarely composed of distinct lines and curves. Scanned images are often stored as bitmaps; even though the original may be line art, you want to store the image as a whole and don’t care about its individual components. A fax machine, for example, doesn’t care what you’ve drawn; it simply transmits pixels from one place to another in raster form.
Tools for creating images in raster format are widespread and generally easier to use than many vector-based tools. There are many different ways to compress and store a raster image, and the internal representation of these formats is public. Program libraries to read and write images in compressed formats such as JPEG, GIF, and PNG are widely available. These are some of the reasons that web browsers have, until the arrival of SVG, supported only raster images.
Vector graphics are used in the following:
- Computer Assisted Drafting (CAD) programs, where accurate measurement and the ability to zoom in on a drawing to see details are essential.
- Programs for designing graphics that will be printed on high-resolution printers (e.g., Adobe Illustrator).
- The Adobe PostScript printing and imaging language; every character that you print is described in terms of lines and curves.
- The vector-based Macromedia Flash system for designing animations, presentations, and websites.
Because most of these files are encoded in binary format or as tightly packed bitstreams, it is difficult for a browser or other user agent to parse out embedded text, or for a server to dynamically create vector graphic files from external data. Most of the internal representations of vector graphics are proprietary, and code to view or create them is not generally available.
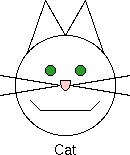
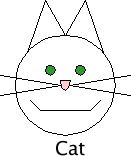
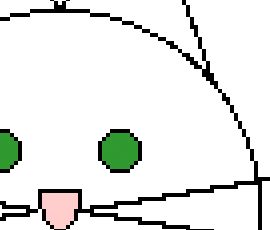
Although they are not as popular as raster graphics, vector graphics have one feature that makes them invaluable in many applications—they can be scaled without loss of image quality. As an example, here are two drawings of a cat. Figure 1-3 was made with raster graphics; Figure 1-4 is a vector image. Both are shown as they appear on a screen that displays 72 pixels per inch.
When a display program zooms in on the raster graphic, it must find some way to expand each pixel. The simplest approach to zooming in by a factor of four is to make each pixel four times as large. The results, shown in Figure 1-5, are not particularly pleasing.
Although it is possible to use techniques such as edge detection and anti-aliasing to make the expanded image more pleasing, these techniques are time-consuming. Furthermore, since all the pixels in a raster graphic are equally anonymous, there’s no guarantee that an algorithm can correctly detect edges of shapes. Anti-aliasing results in something like Figure 1-6.
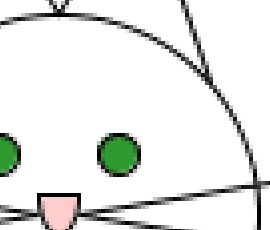
Expanding a vector image by a factor of four, on the other hand, merely requires the display program to multiply all the coordinates of the shapes by four and redraw them at the full resolution of the display device. Thus, Figure 1-7, which is also a screenshot from a 72 dots per inch (DPI) screen, shows crisp, clear edges on the lines with significantly less of the stair-step effects of the expanded raster image.
In 1998, the World Wide Web Consortium formed a working group to develop a representation of vector graphics as an XML application. Because SVG is an XML application, the information about an image is stored as plain text, and it brings the advantages of XML’s openness, transportability, and interoperability.
CAD and graphic design programs often store drawings in a proprietary binary format. By adding the ability to import and export drawings in SVG format, applications gain a common standard format for interchanging information.
Because it is an XML application, SVG cooperates with other XML applications. A mathematics textbook, for example, could use XSL Formatting Objects for explanatory text, MathML to describe equations, and SVG to generate the graphs for the equations.
The SVG working group’s specification is an official World Wide Web Consortium Recommendation. Applications such as Adobe Illustrator and Inkscape can import and export drawings in SVG format. On the Web, SVG is natively supported in many browsers and has many of the same transformation and animation capabilities that CSS-styled HTML has. Because the SVG files are XML, text in the SVG display is available to any user agent that can parse XML.
In this section, you will see an SVG file that produces the image of the cat that you saw earlier in the chapter. This example introduces many of the concepts that you will read about in further detail in subsequent chapters. This file will be a good example of how to write an example file, which is not necessarily the way you should write an SVG file that will be part of a finished project.
Example 1-1 starts with the standard XML processing instruction and DOCTYPE declaration. The root <svg> element defines the width and height of the finished graphic in pixels. It also defines the
SVG namespace via the xmlns attribute. The <title> element’s content is available to a viewing program for use in a title bar or as a tooltip pointer, and the <desc> element lets you give a full description of the image.
Example 1-1. Basic structure of an SVG document
<?xml version="1.0"?><!DOCTYPE svg PUBLIC "-//W3C//DTD SVG 1.1//EN""http://www.w3.org/Graphics/SVG/1.1/DTD/svg11.dtd"><svgwidth="140"height="170"xmlns="http://www.w3.org/2000/svg"><title>Cat</title><desc>Stick Figure of a Cat</desc><!-- the drawing will go here --></svg>
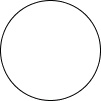
You draw the cat’s face by adding a <circle> element. The element’s attributes specify the center x-coordinate, center y-coordinate, and radius. The (0,0) point is the upper-left corner of the picture. x-coordinates increase as you move horizontally to the right; y-coordinates increase as you move vertically downward.
The circle’s location and size are part of the drawing’s structure. The color in which it is drawn is part of its presentation. As is customary with XML applications, you should separate structure and presentation for maximum flexibility. Presentation information is contained in the style attribute. Its value will be a series of presentation properties and values, as described in Appendix B, in Anatomy of a Style. Use a stroke color of black for the outline, and a fill color of none to make the face transparent. The SVG is shown in Example 1-2, and its result in Figure 1-8.
Example 1-2. Basic shapes—circle
http://oreillymedia.github.io/svg-essentials-examples/ch01/ex01-02.html
<?xml version="1.0"?><!DOCTYPE svg PUBLIC "-//W3C//DTD SVG 1.1//EN" "http://www.w3.org/Graphics/SVG/1.1/DTD/svg11.dtd"><svgwidth="140"height="170"xmlns="http://www.w3.org/2000/svg"><title>Cat</title><desc>Stick Figure of a Cat</desc><circlecx="70"cy="95"r="50"style="stroke: black; fill: none"/></svg>
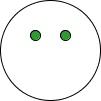
Now add two more circles for the eyes in Example 1-3. Although their fill and stroke colors are really part of the presentation, SVG does allow you to specify them as individual attributes. In this example, the fill and stroke colors are written as two separate attributes rather than together inside the style attribute. You probably won’t use this method often; it’s described further in Chapter 5, in Presentation Attributes. We’ve put it here just to prove that it can be done. The results are shown in Figure 1-9.
The <?xml …?> and <!DOCTYPE?> have been omitted to save space in the listing.
Example 1-3. Basic shapes—filled circles
http://oreillymedia.github.io/svg-essentials-examples/ch01/ex01-03.html
<svgwidth="140"height="170"xmlns="http://www.w3.org/2000/svg"><title>Cat</title><desc>Stick Figure of a Cat</desc><circlecx="70"cy="95"r="50"style="stroke: black; fill: none"/><circlecx="55"cy="80"r="5"stroke="black"fill="#339933"/><circlecx="85"cy="80"r="5"stroke="black"fill="#339933"/></svg>
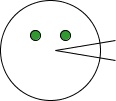
Example 1-4 adds the whiskers on the right side of the cat’s face with two <line> elements. You want to treat these whiskers as a unit (you’ll see why in a moment), so enclose them in the <g> grouping element, and give it an id. You specify a line by giving the x- and y-coordinates for its starting point (x1 and y1) and ending point (x2 and y2). Figure 1-10 shows the result.
Example 1-4. Basic shapes—lines
http://oreillymedia.github.io/svg-essentials-examples/ch01/ex01-04.html
<svgwidth="140"height="170"xmlns="http://www.w3.org/2000/svg"><title>Cat</title><desc>Stick Figure of a Cat</desc><circlecx="70"cy="95"r="50"style="stroke: black; fill: none;"/><circlecx="55"cy="80"r="5"stroke="black"fill="#339933"/><circlecx="85"cy="80"r="5"stroke="black"fill="#339933"/><gid="whiskers"><linex1="75"y1="95"x2="135"y2="85"style="stroke: black;"/><linex1="75"y1="95"x2="135"y2="105"style="stroke: black;"/></g></svg>
Now you will <use> the whiskers group and transform it into the left whiskers. Example 1-5 first flips the coordinate system by multiplying the x-coordinates by negative one in a scale transformation. This means that the point (75,95) is now located at the place that would have been (–75,95) in the original coordinate system. In the new scaled system, coordinates increase as you move left. This means you have to translate (move) the coordinate system 140 pixels right, the negative direction, to get them where you want them, as shown in Figure 1-11.
Example 1-5. Transforming the coordinate system
http://oreillymedia.github.io/svg-essentials-examples/ch01/ex01-05.html
<svgwidth="140"height="170"xmlns="http://www.w3.org/2000/svg"xmlns:xlink="http://www.w3.org/1999/xlink"><title>Cat</title><desc>Stick Figure of a Cat</desc><circlecx="70"cy="95"r="50"style="stroke: black; fill: none;"/><circlecx="55"cy="80"r="5"stroke="black"fill="#339933"/><circlecx="85"cy="80"r="5"stroke="black"fill="#339933"/><gid="whiskers"><linex1="75"y1="95"x2="135"y2="85"style="stroke: black;"/><linex1="75"y1="95"x2="135"y2="105"style="stroke: black;"/></g><usexlink:href="#whiskers"transform="scale(-1 1) translate(-140 0)"/></svg>
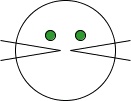
The xlink:href attribute in the <use> element is in a different namespace (see Appendix A for details). To make sure your SVG document will work with all SVG viewers, you must add the xmlns:xlink attribute to the opening <svg> tag.
The transform attribute’s value lists the transformations, one after another, separated by whitespace.
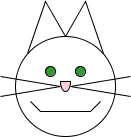
Example 1-6 constructs the ears and mouth with the <polyline> element, which takes pairs of x- and y-coordinates as the points attribute. You separate the numbers with either blanks or commas as you please. The result is in Figure 1-12.
Example 1-6. Basic shapes—polylines
http://oreillymedia.github.io/svg-essentials-examples/ch01/ex01-06.html
<svgwidth="140"height="170"xmlns="http://www.w3.org/2000/svg"xmlns:xlink="http://www.w3.org/1999/xlink"><title>Cat</title><desc>Stick Figure of a Cat</desc><circlecx="70"cy="95"r="50"style="stroke: black; fill: none;"/><circlecx="55"cy="80"r="5"stroke="black"fill="#339933"/><circlecx="85"cy="80"r="5"stroke="black"fill="#339933"/><gid="whiskers"><linex1="75"y1="95"x2="135"y2="85"style="stroke: black;"/><linex1="75"y1="95"x2="135"y2="105"style="stroke: black;"/></g><usexlink:href="#whiskers"transform="scale(-1 1) translate(-140 0)"/><!--ears--><polylinepoints="108 62, 90 10, 70 45, 50, 10, 32, 62"style="stroke: black; fill: none;"/><!--mouth--><polylinepoints="35 110, 45 120, 95 120, 105, 110"style="stroke: black; fill: none;"/></svg>
All of the basic shapes are actually shortcuts for the more general <path> element, which Example 1-7 uses to add the cat’s nose. The result is in Figure 1-13. This element has been designed to make specifying a path, or sequence of lines and curves, as compact as possible. The path in Example 1-7 translates, in words, to “Move to coordinate (75,90). Draw a line to coordinate (65,90). Draw an elliptical arc with an x-radius of 5 and a y-radius of 10, ending back at coordinate (75,90).”
Example 1-7. Using the <path> element
http://oreillymedia.github.io/svg-essentials-examples/ch01/ex01-07.html
<svgwidth="140"height="170"xmlns="http://www.w3.org/2000/svg"xmlns:xlink="http://www.w3.org/1999/xlink"><title>Cat</title><desc>Stick Figure of a Cat</desc><circlecx="70"cy="95"r="50"style="stroke: black; fill: none;"/><circlecx="55"cy="80"r="5"stroke="black"fill="#339933"/><circlecx="85"cy="80"r="5"stroke="black"fill="#339933"/><gid="whiskers"><linex1="75"y1="95"x2="135"y2="85"style="stroke: black;"/><linex1="75"y1="95"x2="135"y2="105"style="stroke: black;"/></g><usexlink:href="#whiskers"transform="scale(-1 1) translate(-140 0)"/><!--ears--><polylinepoints="108 62, 90 10, 70 45, 50, 10, 32, 62"style="stroke: black; fill: none;"/><!--mouth--><polylinepoints="35 110, 45 120, 95 120, 105, 110"style="stroke: black; fill: none;"/><!--nose--><pathd="M 75 90 L 65 90 A 5 10 0 0 0 75 90"style="stroke: black; fill: #ffcccc"/></svg>
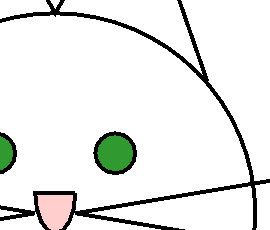
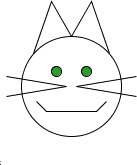
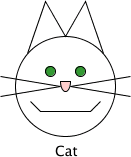
Finally, because this picture is so crudely drawn, there’s a good chance that people will not know it is a cat. Hence, Example 1-8 adds text to the picture as a label. In the <text> element, the x and y attributes that specify the text’s location are part of the structure. The font family and font size are part of the presentation, and thus part of the style attribute. Unlike the other elements you’ve seen, <text> is a container element, and its content is the text you want to display. Figure 1-14 shows the final result.
Example 1-8. Adding a label
http://oreillymedia.github.io/svg-essentials-examples/ch01/ex01-08.html
<svgwidth="140"height="170"xmlns="http://www.w3.org/2000/svg"xmlns:xlink="http://www.w3.org/1999/xlink"><title>Cat</title><desc>Stick Figure of a Cat</desc><circlecx="70"cy="95"r="50"style="stroke: black; fill: none;"/><circlecx="55"cy="80"r="5"stroke="black"fill="#339933"/><circlecx="85"cy="80"r="5"stroke="black"fill="#339933"/><gid="whiskers"><linex1="75"y1="95"x2="135"y2="85"style="stroke: black;"/><linex1="75"y1="95"x2="135"y2="105"style="stroke: black;"/></g><usexlink:href="#whiskers"transform="scale(-1 1) translate(-140 0)"/><!--ears--><polylinepoints="108 62, 90 10, 70 45, 50, 10, 32, 62"style="stroke: black; fill: none;"/><!--mouth--><polylinepoints="35 110, 45 120, 95 120, 105, 110"style="stroke: black; fill: none;"/><!--nose--><pathd="M 75 90 L 65 90 A 5 10 0 0 0 75 90"style="stroke: black; fill: #ffcccc"/><textx="60"y="165"style="font-family: sans-serif; font-size: 14pt; stroke: none; fill: black;">Cat</text></svg>
That concludes our brief overview of SVG; in the following chapters, you’ll examine these concepts in depth.
Get SVG Essentials, 2nd Edition now with the O’Reilly learning platform.
O’Reilly members experience books, live events, courses curated by job role, and more from O’Reilly and nearly 200 top publishers.

