Chapter 8. Plotting and Visualization
Making plots and static or interactive visualizations is one of the most important tasks in data analysis. It may be a part of the exploratory process; for example, helping identify outliers, needed data transformations, or coming up with ideas for models. For others, building an interactive visualization for the web using a toolkit like d3.js (http://d3js.org/) may be the end goal. Python has many visualization tools (see the end of this chapter), but I’ll be mainly focused on matplotlib (http://matplotlib.sourceforge.net).
matplotlib is a (primarily 2D) desktop plotting package designed for creating publication-quality plots. The project was started by John Hunter in 2002 to enable a MATLAB-like plotting interface in Python. He, Fernando Pérez (of IPython), and others have collaborated for many years since then to make IPython combined with matplotlib a very functional and productive environment for scientific computing. When used in tandem with a GUI toolkit (for example, within IPython), matplotlib has interactive features like zooming and panning. It supports many different GUI backends on all operating systems and additionally can export graphics to all of the common vector and raster graphics formats: PDF, SVG, JPG, PNG, BMP, GIF, etc. I have used it to produce almost all of the graphics outside of diagrams in this book.
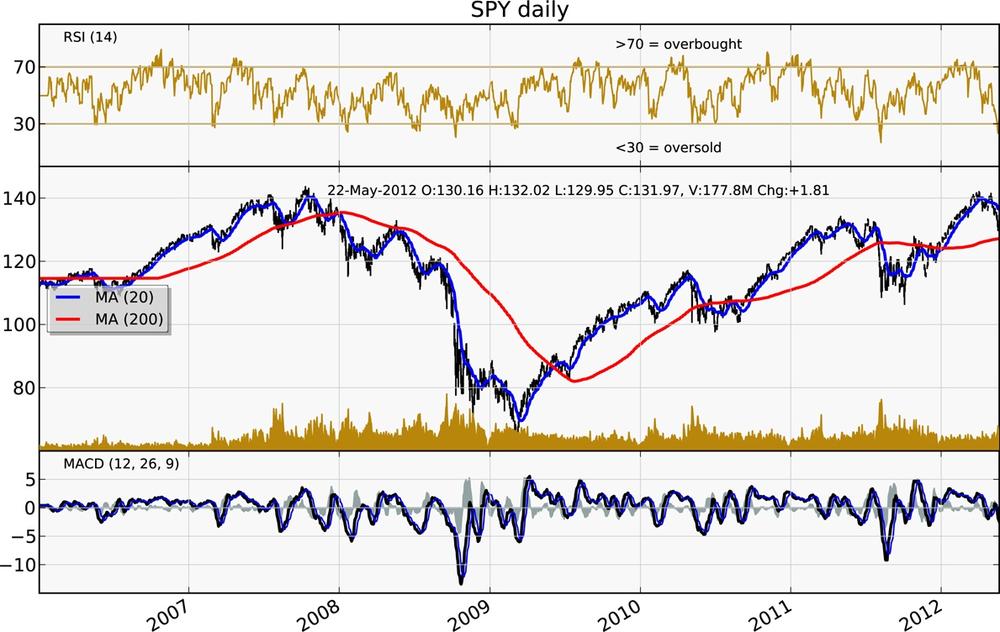
Figure 8-1. A more ...
Get Python for Data Analysis now with the O’Reilly learning platform.
O’Reilly members experience books, live events, courses curated by job role, and more from O’Reilly and nearly 200 top publishers.

