When you implement
mod_perl on your system,
it’s very important to go through the default
configuration file (httpd.conf), because most of
the default settings were designed without mod_perl in mind. Some
variables (such as MaxClients) should be adapted
to the capabilities of your system, while some (such as
KeepAlive, in many cases) should be disabled,
because although they can improve performance for a plain Apache
server, they can reduce performance for a mod_perl server.
Correct configuration of the MinSpareServers,
MaxSpareServers, StartServers,
MaxClients, and
MaxRequestsPerChild parameters is very important.
If they are too low, you will under-use the system’s
capabilities. If they are too high, it is likely that the server will
bring the machine to its knees.
The KeepAlive directive improves the performance
of a plain Apache server by saving the TCP handshake if the client
requests more than one object from your server. But you
don’t want this option to be enabled under mod_perl,
since it will keep a large mod_perl process tied to the client and do
nothing while waiting for the timeout to occur.
We will talk about these and other issues in the following sections.
It’s important to
specify
MaxClients on the basis of the resources
your machine has. The MaxClients directive sets
the limit on the number of simultaneous
requests that can be supported. No
more than this number of child server processes will be created. To
configure more than 256 clients, you must edit the
HARD_SERVER_LIMIT entry in
httpd.h and recompile Apache.
With a plain Apache server, it doesn’t matter
much if you run many child
processes—the processes are about 1 MB each (most of it
shared), so they don’t eat a lot of RAM. The
situation is different with mod_perl, where the processes can easily
grow to 10 MB and more. For example, if you have
MaxClients set to 50, the memory usage becomes 50
× 10 MB = 500 MB.[1] Do you have 500 MB of RAM
dedicated to the mod_perl server?
With a high MaxClients, if you get a high load the
server will try to serve all requests immediately. Your CPU will have
a hard time keeping up, and if the child size multiplied by the
number of running children is larger than the total available RAM,
your server will start swapping. The swapping will slow down
everything, which will lead to more swapping, slowing down everything
even more, until eventually the machine will die.
It’s important that you take pains to ensure that
swapping does not normally happen. Swap space is an emergency pool,
not a resource to be used routinely. If you are low on memory and you
badly need it, buy it. Memory is cheap.
We want the value of MaxClients to be as small as
possible, because in this way we can limit the resources used by the
server’s children. Since we can restrict each
child’s process size, as discussed later, the
calculation of MaxClients is straightforward:
So if we have 400 MB for the mod_perl server to use, we can set
MaxClients to 40 if we know that each child is
limited to 10 MB of memory.
You may be wondering what will happen to your server if there are
more concurrent users than MaxClients. This
situation is pointed out by the following warning message in the
error_log
file:
[Sat May 18 13:40:35 2002] [error] server reached MaxClients setting,
consider raising the MaxClients setting
Technically there is no problem—any connection attempts over
the MaxClients limit will normally be queued, up
to a number based on the ListenBacklog directive.
When a child process is freed at the end of a different request, the
next waiting connection will be served.
But it is an error, because clients are being put in the queue rather than getting served immediately, despite the fact that they do not get an error response. The error can be allowed to persist to balance available system resources and response time, but sooner or later you will need to get more RAM so you can start more child processes. The best approach is to prevent this situation from arising in the first place, and if it keeps on happening you should start worrying about it.
In Chapter 10 we showed that when memory sharing is available, the approximate real memory used can be calculated by adding up all the unshared memory of the client processes plus the memory of the parent process, or, if the latter is unknown, the maximum shared memory size of a single child process, which is smaller than the memory size of the parent process but good enough for our calculations. We have also devised the following formula:
where Total_RAM is of course the estimated total
RAM available to the web server.
Let’s perform some calculations, first with sharing in place:
Total_RAM                = 500Mb
Max_Process_Size         =  10Mb
Min_Shared_RAM_per_Child =   4Mb
then with no sharing in place:
With sharing in place, if your numbers are similar to the ones in our example, you can have 64% more servers without buying more RAM (82 compared to 50).
If you improve sharing and the sharing level is maintained throughout the child’s life, you might get:
Total_RAM            = 500Mb
Max_Process_Size     =  10Mb
Shared_RAM_per_Child =   8Mb
Here we have 392% more servers (246 compared to 50)!
There is one more nuance to remember. The number of requests per
second that your server can serve won’t grow
linearly when you raise the value of MaxClients.
Assuming that you have a lot of RAM available and you try to set
MaxClients as high as possible, you will find that
you eventually reach a point where increasing the
MaxClients value will not improve performance.
The more clients that are running, the more CPU time will be required and the fewer CPU time slices each process will receive. The response latency (the time to respond to a request) will grow, so you won’t see the expected improvement. Let’s explore these issues.
The test handler that we have used is shown in Example 11-1. You can see that it does mostly CPU-intensive computations.
Example 11-1. Book/HandlerBenchmark.pm
package Book::HandlerBenchmark;
use Apache::Constants qw(:common);
sub handler {
    $r = shift;
    $r->send_http_header('text/html');
    $r->print("Hello");
    my $x = 100;
    my $y = log ($x ** 100) for (0..100);
    return OK;
}
1;
Here’s the configuration section to enable this handler:
PerlModule Book::HandlerBenchmark
<Location /benchmark_handler_middle>
    SetHandler perl-script
    PerlHandler Book::HandlerBenchmark
</Location>
Now we will run the benchmark for different values of
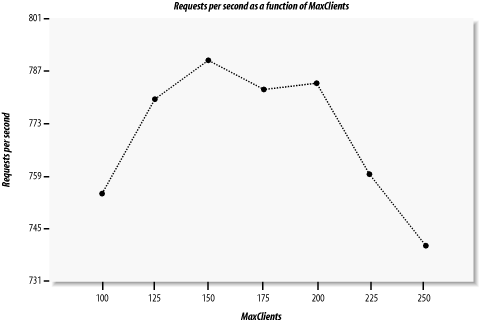
MaxClients. The results are:
MaxClients  | avtime completed failed    rps
--------------------------------------------
       100  |    333     50000      0    755
       125  |    340     50000      0    780
       150  |    342     50000      0    791
       175  |    338     50000      0    783
       200  |    339     50000      0    785
       225  |    365     50000      0    760
       250  |    402     50000      0    741
---------------------------------------------

Non-varying sub-test parameters:
---------------------------------------------
MaxRequestsPerChild : 0
StartServers        : 100
Concurrency         : 300
Number of requests  : 50000
---------------------------------------------
Figure 11-1 depicts requests per second versus
MaxClients. Looking at this figure, you can see
that with a concurrency level of 300, the performance is almost
identical for MaxClients values of 150 and 200,
but it goes down for the value of 100 (not enough processes) and are
even worse for the value of 250 (too many processes competing over
CPU cycles). Note that we have kept the server fully loaded, since
the number of concurrent requests was always higher than the number
of available processes, which means that some requests were queued
rather than responded to immediately. When the number of processes
went above 200, more and more time was spent by the processes in the
sleep state and context switching, enlarging the latency of response
generation. On the other hand, with only 100 available processes, the
CPU was not fully loaded and we had plenty of memory available. You
can see that in our case, a MaxClients value of
150 is close to optimal.[2]
This leads us to an interesting discovery, which we can summarize in the following way: increasing your RAM might not improve the performance if your CPU is already fully loaded with the current number of processes. In fact, if you start more processes, you will get a degradation in performance. On the other hand, if you decide to upgrade your machine with a very powerful CPU but you don’t add enough memory, the machine will use swap memory or the CPU will be under-used; in any case, the performance will be poor. Whenever you opt for a more powerful CPU, you must always budget for enough extra memory to ensure that the CPU’s greater processing power is fully utilized. It is generally best to add more memory in the first place to see if that helps with performance problems (assuming you follow our tuning advice as well).
To discover the right configuration for your server, you should run benchmarks on a machine with identical hardware to the one that you are going to use in production. Try to simulate the probable loads your machine will experience. Remember that the load will be variable, and plan accordingly. Experiment with the configuration parameters under different loads to discover the optimal balance of CPU and RAM use for your machine. When you change the processor or add RAM, retest the configuration to see how to change the settings to get the best from the new hardware.
You can tune your machine using reports like the one in our example,
by analyzing either the requests per second
(rps) column, which shows the throughput of your
server, or the average processing time (avtime)
column, which can be seen as the latency of your server. Take more
samples to build nicer linear graphs, and pick the value of
MaxClients where the curve reaches a maximum value
for a throughput graph or reaches the minimum value for a latency
graph.
The MaxRequestsPerChild
directive sets the limit on the
number of requests that an individual child process can handle during
its lifetime. After MaxRequestsPerChild requests,
the child process will die. If MaxRequestsPerChild
is zero, the process will live until the server kills it (because it
is no longer needed, which will depend on the value of
MinSpareServers and the number of current
requests) or until the server itself is stopped.
Setting MaxRequestsPerChild to a non-zero limit
solves some memory-leakage problems caused by sloppy programming
practices and bugs, whereby a child process consumes a little more
memory after each request. In such cases, and where the directive is
left unbounded, after a certain number of requests the children will
use up all the available memory and the server will die from memory
starvation. Note that sometimes standard system libraries leak memory
too, especially on operating systems with bad memory management.
If this is your situation you may want to set
MaxRequestsPerChild to a small number. This will
allow the system to reclaim the memory that a greedy child process
has consumed when it exits after
MaxRequestsPerChild requests.
But beware—if you set this number too low, you will lose some
of the speed bonus you get from mod_perl. Consider using
Apache::PerlRun if the leakage is in the CGI
script that you run. This handler flushes all the memory used by the
script after each request. It does, however, reduce performance,
since the script’s code will be loaded and
recompiled for each request, so you may want to compare the loss in
performance caused by Apache::PerlRun with the
loss caused by memory leaks and accept the lesser of the evils.
Another approach is to use the memory usage-limiting modules,
Apache::SizeLimit or
Apache::GTopLimit. If you use either of these
modules, you shouldn’t need to set
MaxRequestPerChild (i.e., you can set it to
0), although for some developers, using both in
combination does the job. These modules also allow you to control the
maximum unshared and minimum shared memory sizes. We discuss these
modules in Chapter 14.
With mod_perl
enabled, it might take as
much as 20 seconds from the time you start the server until it is
ready to serve incoming requests. This delay depends on the OS, the
number of preloaded modules, and the process load of the machine.
It’s best to set StartServers and
MinSpareServers to high numbers, so that if you
get a high load just after the server has been restarted, the fresh
servers will be ready to serve requests immediately.
To maximize the benefits of mod_perl, you don’t want
to kill servers when they are idle; rather, you want them to stay up
and available to handle new requests immediately. We think an ideal
configuration is to set MinSpareServers and
MaxSpareServers to similar (or even the same)
values. Having MaxSpareServers close to
MaxClients will completely use all of your
resources (if MaxClients has been chosen to take
full advantage of the resources) and make sure that at any given
moment your system will be capable of responding to requests with the
maximum speed (assuming that the number of concurrent requests is not
higher than MaxClients—otherwise, some
requests will be put on hold).
If you keep a small number of servers active most of the time, keep
StartServers low. Keep it low especially if
MaxSpareServers is also low, as if there is no
load Apache will kill its children before they have been utilized at
all. If your service is heavily loaded, make
StartServers close to
MaxClients, and keep
MaxSpareServers equal to
MaxClients.
If your server performs other work besides running the
mod_perl-enabled server—for example, an SQL server—make
MinSpareServers low so the memory of unused
children will be freed when the load is light. If your
server’s load varies (i.e., you get loads in bursts)
and you want fast responses for all clients at any time, you will
want to make it high, so that new children will be respawned in
advance and able to handle bursts of requests.
For MaxSpareServers, the logic is the same as for
MinSpareServers—low if you need the machine
for other tasks, high if it’s a host dedicated to
mod_perl servers and you want a minimal delay between the request and
the response.
If your mod_perl server’s httpd.conf file includes the following directives:
KeepAlive On
MaxKeepAliveRequests 100
KeepAliveTimeout 15
you have a real performance penalty, since after completing the
processing for each request, the process will wait for
KeepAliveTimeout seconds before closing the
connection and will therefore not be serving other requests during
this time. With this configuration you will need many more concurrent
processes on a server with high traffic.
If you use the mod_status or Apache::VMonitor
server status reporting tools, you will see a process in
K state when it’s in
KeepAlive state.
You will probably want to switch this feature off:
KeepAlive Off
The other two directives don’t matter if
KeepAlive is Off.
However, you might consider enabling KeepAlive if
the client’s browser needs to request more than one
object from your mod_perl server for a single HTML page. If this is
the situation, by setting KeepAlive
On, for every object rendered in the HTML page on
the client’s browser you save the HTTP connection
overhead for all requests but the first one.
For example, if the only thing your mod_perl server does is process
ads, and each of your pages has 10 or more banner ads (which is not
uncommon today), your server will work more efficiently if a single
process serves them all during a single connection. However, your
client will see a slightly slower response, since the banners will be
brought one at a time and not concurrently, as is the case if each
<img> tag opens a separate connection.
SSL connections benefit the most from KeepAlive if
you don’t configure the server to cache session IDs.
See the mod_ssl documentation for how to do this.
You have probably followed our advice to send all the requests for
static objects to a plain Apache (proxy/accelerator) server. Since
most pages include more than one unique static image, you should keep
the default KeepAlive setting of the non-mod_perl
server (i.e., keep it On). It will probably also
be a good idea to reduce the KeepAliveTimeout to 1
or 2 seconds—a client is going to send a new request on the
KeepAlive connection immediately, and the first
bits of the request should reach the server within this limit, so
wait only for the maximum latency of a modem connection plus a little
bit more.
Another option is for the proxy/accelerator to keep the connection open to the client but make individual connections to the server, read the responses, buffer them for sending to the client, and close the server connection. Obviously, you would make new connections to the server as required by the client’s requests.
By default,
PerlSetupEnv
is
On, but PerlSetupEnv Off is
another optimization you should consider.
mod_perl modifies the environment to make it appear as if the script
were being called under the CGI protocol. For example, the
$ENV{QUERY_STRING} environment variable is
initialized with the contents of $r->args( ),
and the value returned by $r->server_hostname(
) is put into $ENV{SERVER_NAME}.
But populating %ENV is expensive. Those who have
moved to the mod_perl API no longer need this duplicated data and can
improve performance by turning it off. Scripts using the
CGI.pm module require PerlSetupEnv
On because that module relies on the environment created by
mod_cgi. This is yet another reason why we recommend using the
Apache::Request module in preference to
CGI.pm.
Note that you can still set environment variables when
PerlSetupEnv is Off. For
example, say you use the following configuration:
PerlSetupEnv Off
PerlModule Apache::RegistryNG
<Location /perl>
    PerlSetEnv TEST hi
    SetHandler perl-script
    PerlHandler Apache::RegistryNG
    Options +ExecCGI
</Location>
Now issue a request for the script shown in Example 11-2.
Example 11-2. setupenvoff.pl
use Data::Dumper;
my $r = Apache->request( );
$r->send_http_header('text/plain');
print Dumper \%ENV;
You should see something like this:
$VAR1 = {
          'GATEWAY_INTERFACE' => 'CGI-Perl/1.1',
          'MOD_PERL' => 'mod_perl/1.26',
          'PATH' => '/bin:/usr/bin:/usr... snipped ...',
          'TEST' => 'hi'
        };
Note that we got the value of the TEST environment
variable we set in httpd.conf.
If (using
truss,
strace, or another tool available for your OS)
you watch the system calls that your mod_perl server makes while
processing a request, you will notice that a few stat(
) calls are made, and these are quite expensive. For
example, if you have your DocumentRoot set to
/home/httpd/docs and you fetch
http://localhost/perl-status, you will see:
[snip]
stat("/home/httpd/docs/perl-status", 0xbffff8cc) = -1
ENOENT (No such file or directory)
stat("/home/httpd/docs", {st_mode=S_IFDIR|0755,
st_size=1024, ...}) = 0
[snip]If you have some dynamic content and your virtual relative URI is
looks like /news/perl/mod_perl/summary (i.e.,
there is no such directory on the web server—the path
components are used only for requesting a specific report), this will
generate five stat( ) calls before the
DocumentRoot is reached and the search is stopped.
You will see something like this:
stat("/home/httpd/docs/news/perl/mod_perl/summary", 0xbffff744) = -1
ENOENT (No such file or directory)
stat("/home/httpd/docs/news/perl/mod_perl", 0xbffff744) = -1
ENOENT (No such file or directory)
stat("/home/httpd/docs/news/perl", 0xbffff744) = -1
ENOENT (No such file or directory)
stat("/home/httpd/docs/news", 0xbffff744) = -1
ENOENT (No such file or directory)
stat("/home/httpd/docs",
{st_mode=S_IFDIR|0755, st_size=1024, ...}) = 0How expensive are these calls? Let’s use the
Time::HiRes
module to find out.
The script in Example 11-3, which you should run on
the command line, takes a time sample at the beginning, then does a
million stat( ) calls to a nonexistent file,
samples the time at the end, and prints the average time it took to
make a single stat( ) call.
Example 11-3. stat_call_sample.pl
use Time::HiRes qw(gettimeofday tv_interval); my $calls = 1_000_000; my $start_time = [ gettimeofday ]; stat "/foo" for 1..$calls; my $end_time = [ gettimeofday ]; my $avg = tv_interval($start_time,$end_time) / $calls; print "The average execution time: $avg seconds\n";
Before we actually run the script we should distinguish between two different scenarios. When the server is idle, the time between the first and the last system call will be much shorter than the same time measured on a loaded system. This is because on an idle system, a process can use the CPU very often, whereas on a loaded system, lots of processes compete for CPU time and each process has to wait longer to get the same amount of CPU time.
So first we run the above code on an unloaded system:
panic% perl stat_call_sample.pl The average execution time: 4.209645e-06 seconds
Here it takes about four microseconds to execute a stat(
) call. Now we’ll start a CPU-intensive
process in one console (make sure to kill the process afterward!).
The following code keeps the CPU busy all the time:
panic% perl -e '1 while 1'
And now we run the stat_call_sample.pl script in another console:
panic% perl stat_call_sample.pl The average execution time: 8.777301e-06 seconds
You can see that the average time has doubled (about eight microseconds). This is intuitive, since there were two processes competing for CPU resources. Now if we run four occurrences of the above code:
panic% perl -e '1**1 while 1' & panic% perl -e '1**1 while 1' & panic% perl -e '1**1 while 1' & panic% perl -e '1**1 while 1' &
and run our script in parallel with these processes, we get:
panic% perl stat_call_sample.pl 2.0853558e-05 seconds
So the average stat( ) system call is five times
longer now (about 20 microseconds). Now if you have 50 mod_perl
processes that keep the CPU busy all the time, the stat(
) call will be 50 times slower and it’ll
take 0.2 milliseconds to complete a series of calls. If you have five
redundant calls, as in the strace example above,
they add up to one millisecond. If you have more processes constantly
consuming CPU resources, this time adds up. Now multiply this time by
the number of processes that you have and you get a few seconds lost.
For some services this loss is insignificant, while for others it
could be very significant.
So why does Apache do all these redundant stat( )
calls? The reason is the default installed
TransHandler. One solution would be to supply our
own, which would be smart enough not to look for this virtual path
and would immediately return OK. In cases where
you have a virtual host that serves only dynamically generated
documents, you can override the default
PerlTransHandler
with the following one:
PerlModule Apache::Constants
<VirtualHost 10.10.10.10:80>
...
PerlTransHandler Apache::Constants::OK
...
</VirtualHost>The Apache::Constants::OK constant (which is
actually a subroutine) is used here as a handler that does nothing
but finish the translation phase by returning OK.
By skipping the default translation handler, which tries to find a
filesystem component that matches the given URI, you save the
redundant stat( ) calls!
As you see, it affects only this specific virtual host. Remember that
PerlTransHandler cannot appear inside a specific
<Location> or similar section, because the
request has not yet been associated with a particular file or
directory.
As we will show next, Apache’s default
TransHandler may perform several stat(
) calls when the request is served by a virtual resource
that doesn’t reside on the filesystem. Things get
worse when Apache is configured to look for
.htaccess files, adding many redundant
open( ) calls.
Let’s start with the following simple configuration and try to reduce the number of redundant system calls to a minimum:
DocumentRoot "/home/httpd/docs"
<Directory />
AllowOverride All
</Directory>
<Location /foo/test>
SetHandler perl-script
PerlHandler Apache::Foo
</Location>The above configuration causes the Perl handler( )
defined in Apache::Foo to be executed when we make
a request to /foo/test. Notice that in the test
setup there is no real file to be executed and no
.htaccess file.
Using the above configuration, the system calls trace may look as follows:
stat("/home/httpd/docs/foo/test", 0xbffff8fc) = -1 ENOENT
(No such file or directory)
stat("/home/httpd/docs/foo", 0xbffff8fc) = -1 ENOENT
(No such file or directory)
stat("/home/httpd/docs",
{st_mode=S_IFDIR|0755, st_size=1024, ...}) = 0
open("/.htaccess", O_RDONLY) = -1 ENOENT
(No such file or directory)
open("/home/.htaccess", O_RDONLY) = -1 ENOENT
(No such file or directory)
open("/home/httpd/.htaccess", O_RDONLY) = -1 ENOENT
(No such file or directory)
open("/home/httpd/docs/.htaccess", O_RDONLY) = -1 ENOENT
(No such file or directory)
stat("/home/httpd/docs/test", 0xbffff774) = -1 ENOENT
(No such file or directory)
stat("/home/httpd/docs",
{st_mode=S_IFDIR|0755, st_size=1024, ...}) = 0Now we modify the <Directory> entry and add
AllowOverride None, which, among other things,
tells Apache not to search for .htaccess files:
<Directory />
AllowOverride None
</Directory>After restarting the server and issuing a request to
/foo/test, we see that the four open(
) calls for .htaccess have gone. The
remaining system calls are:
stat("/home/httpd/docs/foo/test", 0xbffff8fc) = -1 ENOENT
(No such file or directory)
stat("/home/httpd/docs/foo", 0xbffff8fc) = -1 ENOENT
(No such file or directory)
stat("/home/httpd/docs",
{st_mode=S_IFDIR|0755, st_size=1024, ...}) = 0
stat("/home/httpd/docs/test", 0xbffff774) = -1 ENOENT
(No such file or directory)
stat("/home/httpd/docs",
{st_mode=S_IFDIR|0755, st_size=1024, ...}) = 0Next, let’s try to shortcut the foo location with:
Alias /foo/ /
which makes Apache look for the file in the / directory and not under /home/httpd/docs/foo. Let’s restart the server and try again:
stat("/test", 0xbffff8fc) = -1 ENOENT (No such file or directory)Now we’ve got only one stat( )
call left!
Let’s replace the Alias setting
we have just added with:
PerlModule Apache::Constants PerlTransHandler Apache::Constants::OK
as explained earlier. When we issue the request, we see no remaining
stat( ) calls. This technique works if you serve
content using only mod_perl handlers, since CGI scripts and other
files won’t be looked for on the filesystem now.
Also, since the default translation handler is now skipped,
$r->filename now won’t be set.
If you want to serve both mod_perl handlers and real files, you will
have to write your own
PerlTransHandler
to handle requests as desired. For
example, the following PerlTransHandler will not
look up the file on the filesystem if the URI starts with
/foo—the handler will return
DECLINED and the default
PerlTransHandler will be used:
PerlTransHandler 'sub { return shift->uri( ) =~ m|^/foo| \
? Apache::Constants::OK \
: Apache::Constants::DECLINED; }'Let’s see the same configuration using a
<Perl> section and a dedicated package (see
Example 11-4).
Example 11-4. perl_section.conf
<Perl>
package Book::Trans;
use Apache::Constants qw(:common);
sub handler {
my $r = shift;
return OK if $r->uri( ) =~ m|^/foo|;
return DECLINED;
}
package Apache::ReadConfig;
$PerlTransHandler = "Book::Trans";
</Perl>Here we have defined the Book::Trans package and
implemented the handler( ) function. Then we have
assigned this handler to the PerlTransHandler.
You can move the code in the module into an external file (e.g.,
Book/Trans.pm) and configure the
PerlTransHandler with:
PerlTransHandler Book::Trans
in the normal way (no <Perl> section
required).
Now we’ll run some benchmarks to test the solutions
described above, both individually and in groups. To make the
difference in the number of stat( ) calls more
prominent, we will use a very light handler that just prints
something out.
The module that we have used is shown in Example 11-5.
Example 11-5. Book/News.pm
package Book::News;
use Apache::Constants qw(:common);
sub handler {
my $r = shift;
my $uri = $r->uri;
my @sections = split "/", $uri;
# in a real handler you'd do some DB lookup and return the story:
# my $story = get_story(@sections);
$r->send_http_header('text/plain');
print "Story matching @sections\n";
return OK;
}
1;This is the URI we have used for testing:
/news/perl/mod_perl/summary
Notice that the URI is long enough to generate many stat(
) calls with the default Apache configuration.
This is the main configuration:
<Location /news>
SetHandler perl-script
PerlHandler +Book::News
</Location>Now we try different configurations and see how they influence performance. Each configuration is listed with a tag in parentheses that is used as a key in the table and explanation that follows.
(default) Nothing was added:
<Directory /> AllowOverride All </Directory>(noht) Prevent .htaccess lookup:
<Directory /> AllowOverride None </Directory>(alias) Location alias shortcutting:
Alias /news /
(trans) Using a nondefault
TransHandler:<Perl> package Book::Trans; use Apache::Constants qw(:common); sub handler { my $r = shift; return OK if $r->uri( ) =~ m|^/news|; return DECLINED; } package Apache::ReadConfig; $PerlTransHandler = "Book::Trans"; </Perl>
The results, sorted by the requests per second (rps) rate, are:
Options | avtime completed failed rps -----------|------------------------------- noht+alias | 27 5000 0 996 noht+trans | 29 5000 0 988 trans | 29 5000 0 975 alias | 28 5000 0 974 noht | 32 5000 0 885 default | 34 5000 0 827
with static arguments:
Concurrency : 30 Number of requests : 5000
The concurrency and connections don’t matter here; we are concerned with the relative rather than the absolute numbers.
Figure 11-2 depicts these results.
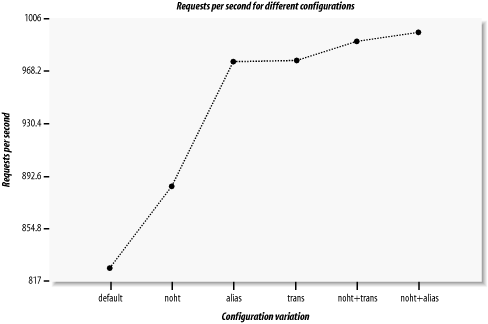
Preventing .htaccess lookup
(noht) improved the performance by about 8% (885
versus 827). Using alias shortcutting (alias) or
a nondefault TransHandler
(trans) gave even more of a performance boost:
since for a long URI like the one in our example, each directory
generates a few stat( ) and open(
) system calls, the speedup was around 15% compared to the
standard configuration (default). Grouping the
prevention of .htaccess lookup
(noht) plus one of the techniques that
don’t look for the nonexistent file in the
filesystem (alias or trans)
gave a performance boost of about 18% (996 versus 827).
As we have seen, the number of pseudo-subdirectories is in direct
proportion to the number of stat( ) and
open( ) system calls that are made. To prove this,
let’s use the standard configuration
(default) and benchmark three URIs with a
different number of sections (directories), without counting the
first section (/news):
Sections  URI
---------------------------------------------
1         /news/perl
3         /news/perl/mod_perl/summary
5         /news/perl/mod_perl/summary/foo/bar
The results are what we expected:
Sections  | avtime completed failed    rps
---------------------------------------------------
       1  |     33      5000      0    849
       3  |     34      5000      0    829
       5  |     35      5000      0    801
---------------------------------------------------
Each of the two sections add an extra millisecond to the average processing and connection time, which reduces performance by about 25 requests per second.
It’s important to read the figures cautiously. Improving performance by 20% simply by adding a few configuration directives is not likely to be achieved in practice. In our test code we used a very light handler, which did nothing but send a few lines of text without doing any processing. When you use real code, whose runtime is not 30-40 milliseconds but 300-400 milliseconds, the improvement of 7 milliseconds on average (as we saw between the standard configuration (default), giving 34 ms, and the combination of noht and alias, giving 27 ms) might be insignificant. The tuning we’ve discussed here is important mostly for servers that serve millions of requests per day and where every millisecond counts.
But even if your server has a light load, you can still make it a little bit faster. Use a benchmark on the real code and see whether you win something or not.
The two options
FollowSymLinks
and
SymLinksIfOwnerMatch
are designed for the user’s security. Unless
FollowSymLinks is enabled, symbolic links will not
be followed by the server. If SymLinksIfOwnerMatch
is enabled, the server will follow symbolic links only when the
target file or directory is owned by the same user as the link. Note
that the two options are ignored if set within a
<Location> block.
This protection costs a little overhead for each request. Wherever in your URL-space you do not have this setting:
Options FollowSymLinks
or you do have this setting:
Options SymLinksIfOwnerMatch
Apache will have to issue an extra call to lstat(
) per directory segment in the path to the file. For
example, if you have:
DocumentRoot /home/httpd/docs
<Directory />
Options SymLinksIfOwnerMatch
</Directory>and a request is made for the URI /index.html,
Apache will perform lstat( ) on these three
directories and one file:
/home /home/httpd /home/httpd/docs /home/httpd/docs/index.html
The deeper the file is located in the filesystem, the more
lstat( ) system calls will be made. The results of
these lstat( ) calls are never cached, so they
will occur for every single request. If you really want the
symbolic-links security checking, you can do something like this:
DocumentRoot /home/httpd/docs
<Directory />
    Options FollowSymLinks
</Directory>
<Directory /home/httpd/docs>
    Options -FollowSymLinks +SymLinksIfOwnerMatch
</Directory>
This at least avoids the extra checks for the
DocumentRoot path. Note that
you’ll need to add similar sections if you have any
Alias or RewriteRule paths
outside of your document root. For highest performance, and no
symbolic link protection, set the FollowSymLinks
option everywhere, and never set the
SymLinksIfOwnerMatch option.
You should make sure that your httpd.conf file has this setting:
HostnameLookups Off
This is the default.
If this directive is set to On (or even worse,
Double), Apache will try to use DNS resolution to
translate the client’s IP address into its hostname
for every single request.
The problem is that there are many servers with broken reverse DNS, which means that resolution will never succeed, but it might take a significant time for the lookup attempt to time out. The web page will not be served before the lookup has either succeeded or timed out, because it’s assumed that if you have this feature enabled you want to know the hostname from which the request came. Consequently Apache won’t run any script or handler until the lookup attempt has concluded.
Moreover, you can end up with a hostname that is completely useless and gives you far less information than the IP address would. To avoid this problem you can enable:
HostnameLookups Double
which does a reverse lookup, then a forward lookup on what it gets to make sure that the IP address is not being spoofed. However, this double lookup makes it even slower.
If you need DNS names in some CGI script or handler, you should use
gethostbyname( ) or its equivalents.
In addition to having HostnameLookups turned off,
you should avoid using hostname-based access control and use IP-based
access control instead. If you have a setting like this:
<Location /perl-status>
    ...
    Order deny, allow
    Deny  from all
    Allow from www.example.com
</Location>
the server will have to perform a double reverse DNS lookup for each
incoming IP address to make sure it matches the domain name listed in
the Allow directive and is not being spoofed. Of
course, in our example this will happen only for requests for URIs
starting with /perl-status.
This is another way to do the authorization based on the IP address:
<Location /perl-status>
    ...
    Order deny, allow
    Deny  from all
    Allow from 128.9.176.32
</Location>
Note that since some IP addresses map to multiple hosts (multiple CNAME records), this solution will not always do what you want.
Have you ever served a huge HTML file (e.g., a file bloated with JavaScript code) and wondered how you could send it compressed, thus dramatically cutting down the download times? After all, Java applets can be compressed into a jar and benefit from faster download times. Why can’t we do the same with plain text files (HTML, JavaScript, etc.)? Plain text can often be compressed by a factor of 10.
Apache::GzipChain
can help you with this task. If a client
(browser) understands gzip encoding, this module
compresses the output and sends it downstream. The client
decompresses the data upon receiving it and renders the HTML as if it
was fetching uncompressed HTML. Furthermore, this module is used as a
filter, thanks to Apache::OutputChain, and can
therefore compress not only static files but also dynamic content
created from your handlers or scripts.
For example, to compress all HTML files on the fly, do this:
<Files *.html>
    SetHandler perl-script
    PerlHandler Apache::OutputChain Apache::GzipChain Apache::PassFile
</Files>
Browsers are supposed to declare that they can handle compressed
input by setting the Accept-Encoding header.
Unfortunately, many browsers cannot handle it, even if they claim
that they can. Apache::GzipChain keeps a list of
user agents, and also looks at the User-Agent
header to check for browsers known to accept compressed output.
As an example, if you want to return compressed files that will in
addition pass through the Embperl module, you
would write:
<Location /test>
    SetHandler perl-script
    PerlHandler Apache::OutputChain Apache::GzipChain \
                Apache::EmbperlChain Apache::PassFile
</Location>
Watch the access_log file to see how many bytes were actually sent, and compare that with the bytes sent using a regular configuration.
Notice that the rightmost PerlHandler must be a
content producer. Here we are using
Apache::PassFile, but you can use any module that
creates output.
Alternatively, you may want to try
Apache::Compress, which is compatible with
Apache::Filter and is covered in Appendix B. To compress only outgoing static files, you
can look at the mod_gzip and mod_deflate modules for Apache.
The cool thing about these modules is that they don’t require any modification of the code. To enable or disable them, only httpd.conf has to be tweaked.
Apache Performance Notes: http://httpd.apache.org/docs/misc/perf-tuning.html.
OS-specific hints on running a high-performance web server: http://httpd.apache.org/docs/misc/perf.html.
“The Case for Persistent-Connection HTTP,” by Jeffrey C. Mogul: http://www.research.compaq.com/wrl/techreports/abstracts/95.4.html.
This paper discusses the pros and cons of persistent-connection HTTP, in particular talking about
KeepAlive.Chapter 9 (“Tuning Apache and mod_perl) in mod_perl Developer’s Cookbook, by Geoffrey Young, Paul Lindner, and Randy Kobes (Sams Publishing).
[1] Of course, you also have to take into account the shared memory usage, as described in Chapter 10.
[2] When we tried the same benchmark on different machines with a much stronger CPU and more memory, we saw different results. So we would like to stress again that the optimal configuration choices for a given application and load pattern may vary from machine to machine.
Get Practical mod_perl now with the O’Reilly learning platform.
O’Reilly members experience books, live events, courses curated by job role, and more from O’Reilly and nearly 200 top publishers.

