Chapter 1. Introducing Ganglia
If you’re reading this, odds are you have a problem to solve. I won’t presume to guess the particulars, but I’m willing to bet that the authors of this book have shared your pain at one time or another, so if you’re in need of a monitoring and metrics collection engine, you’ve come to the right place. We created Ganglia for the same reason you’ve picked up this book: we had a problem to solve.
If you’ve looked at other monitoring tools, or have already implemented a few, you’ll find that Ganglia is as powerful as it is conceptually and operationally different from any monitoring system you’re likely to have previously encountered. It runs on every popular OS out there, scales easily to very large networks, and is resilient by design to node failures. In the real world, Ganglia routinely provides near real-time monitoring and performance metrics data for computer networks that are simply too large for more traditional monitoring systems to handle, and it integrates seamlessly with any traditional monitoring systems you may happen to be using.
In this chapter, we’d like to introduce you to Ganglia and help you evaluate whether it’s a good fit for your environment. Because Ganglia is a product of the labor of systems guys—like you—who were trying to solve a problem, our introduction begins with a description of the environment in which Ganglia was born and the problem it was intended to solve.
It’s a Problem of Scale
Say you have a lot of machines. I’m not talking a few hundred, I mean metric oodles of servers, stacked floor to ceiling as far as the eye can see. Servers so numerous that they put to shame swarms of locusts, outnumber the snowflakes in Siberia, and must be expressed in scientific notation, or as some multiple of Avogadro’s number.
Okay, maybe not quite that numerous, but the point is, if you had lots of machines, how would you go about gathering a metric—the CPU utilization, say—from every host every 10 seconds? Assuming 20,000 hosts, for example, your monitoring system would need to poll 2,000 hosts per second to achieve a 10-second resolution for that singular metric. It would also need to store, graph, and present that data quickly and efficiently. This is the problem domain for which Ganglia was designed; to monitor and collect massive quantities of system metrics in near real time for Large installations. Large. With a capital L.
Large installations are interesting because they force us to reinvent or at least reevaluate every problem we thought we’d already solved as systems administrators. The prospect of firing up rsync or kludging together some Perl is altogether different when 20,000 hosts are involved. As the machines become more numerous, we’re more likely to care about the efficiency of the polling protocol, we’re more likely to encounter exceptions, and we’re less likely to interact directly with every machine. That’s not even mentioning the quadratic curve towards infinity that describes the odds of some subset of our hosts going offline as the total number grows.
I don’t mean to imply that Ganglia can’t be used in smaller networks—swarms of locusts would laugh at my own puny corporate network and I couldn’t live without Ganglia—but it’s important to understand the design characteristics from which Ganglia was derived, because as I mentioned, Ganglia operates quite differently from other monitoring systems because of them. The most influential consideration shaping Ganglia’s design is certainly the problem of scale.
Hosts ARE the Monitoring System
The problem of scale also changes how we think about systems management, sometimes in surprising or counterintuitive ways. For example, an admin over 20,000 systems is far more likely to be running a configuration management engine such as Puppet/Chef or CFEngine and will therefore have fewer qualms about host-centric configuration. The large installation administrator knows that he can make configuration changes to all of the hosts centrally. It’s no big deal. Smaller installations instead tend to favor tools that minimize the necessity to configure individual hosts.
Large installation admin are rarely concerned about individual node failures. Designs that incorporate single points of failure are generally to be avoided in large application frameworks where it can be safely assumed, given the sheer amount of hardware involved, that some percentage of nodes are always going to be on the fritz. Smaller installations tend to favor monitoring tools that strictly define individual hosts centrally and alert on individual host failures. This sort of behavior quickly becomes unwieldy and annoying in larger networks.
If you think about it, the monitoring systems we’re used to dealing with all work the way they do because of this “little network” mind set. This tendency to centralize and strictly define the configuration begets a central daemon that sits somewhere on the network and polls every host every so often for status. These systems are easy to use in small environments: just install the (usually bloated) agent on every system and configure everything centrally, on the monitoring server. No per-host configuration required.
This approach, of course, won’t scale. A single daemon will always be capable of polling only so many hosts, and every host that gets added to the network increases the load on the monitoring server. Large installations sometimes resort to installing several of these monitoring systems, often inventing novel ways to roll up and further centralize the data they collect. The problem is that even using roll-up schemes, a central poller can poll an individual agent only so fast, and there’s only so much polling you can do before the network traffic becomes burdensome. In the real world, central pollers usually operate on the order of minutes.
Ganglia, by comparison, was born at Berkeley, in an academic, Grid-computing culture. The HPC-centric admin and engineers who designed it were used to thinking about massive, parallel applications, so even though the designers of other monitoring systems looked at tens of thousands of hosts and saw a problem, it was natural for the Berkeley engineers to see those same hosts as the solution.
Ganglia’s metric collection design mimics that of any well-designed parallel application. Every individual host in the grid is an active participant, and together they cooperate, organically distributing the workload while avoiding serialization and single points of failure. The data itself is replicated and dispersed throughout the Grid without incurring a measurable load on any of the nodes. Ganglia’s protocols were carefully designed, optimizing at every opportunity to reduce overhead and achieve high performance.
This cooperative design means that every node added to the network only increases Ganglia’s polling capacity and that the monitoring system stops scaling only when your network stops growing. Polling is separated from data storage and presentation, both of which may also be redundant. All of this functionality is bought at the cost of a bit more per-host configuration than is employed by other, more traditional monitoring systems.
Redundancy Breeds Organization
Large installations usually include quite a bit of machine redundancy. Whether we’re talking about HPC compute nodes or web, application, or database servers, the thing that makes large installations large is usually the preponderance of hosts that are working on the same problem or performing the same function. So even though there may be tens of thousands of hosts, they can be categorized into a few basic types, and a single configuration can be used on almost all hosts that have a type in common. There are also likely to be groups of hosts set aside for a specific subset of a problem or perhaps an individual customer.
Ganglia assumes that your hosts are somewhat redundant, or at least that they can be organized meaningfully into groups. Ganglia refers to a group of hosts as a “cluster,” and it requires that at least one cluster of hosts exists. The term originally referred to HPC compute clusters, but Ganglia has no particular rules about what constitutes a cluster: hosts may be grouped by business purpose, subnet, or proximity to the Coke machine.
In the normal mode of operation, Ganglia clusters share a multicast address. This shared multicast address defines the cluster members and enables them to share information about each other. Clusters may use a unicast address instead, which is more compatible with various types of network hardware, and has performance benefits, at the cost of additional per-host configuration. If you stick with multicast, though, the entire cluster may share the same configuration file, which means that in practice Ganglia admins have to manage only as many configuration files as there are clusters.
Is Ganglia Right for You?
You now have enough of the story to evaluate Ganglia for your own needs. Ganglia should work great for you, provided that:
You have a number of computers with general-purpose operating systems (e.g., not routers, switches, and the like) and you want near real-time performance information from them. In fact, in cooperation with the sFlow agent, Ganglia may be used to monitor network gear such as routers and switches (see Chapter 8 for more information).
You aren’t averse to the idea of maintaining a config file on all of your hosts.
Your hosts can be (at least loosely) organized into groups.
Your operating system and network aren’t hostile to multicast and/or User Datagram Protocol (UDP).
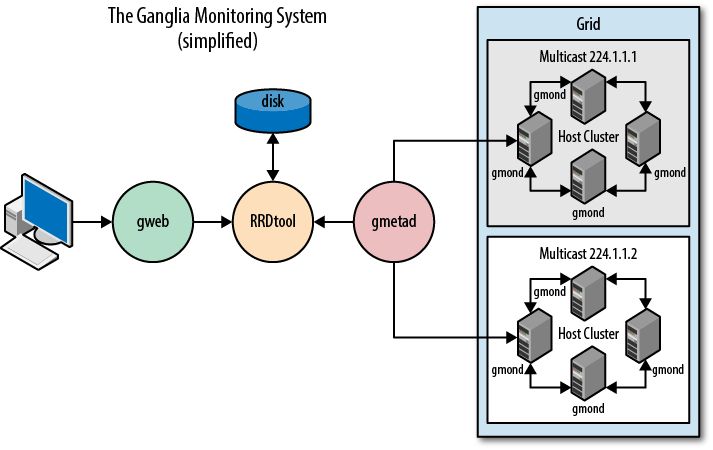
If that sounds like your setup, then let’s take a closer look at Ganglia. As depicted in Figure 1-1, Ganglia is architecturally composed of three daemons: gmond, gmetad, and gweb. Operationally, each daemon is self-contained, needing only its own configuration file to operate; each will start and run happily in the absence of the other two. Architecturally, however, the three daemons are cooperative. You need all three to make a useful installation. (Certain advanced features such as sFlow, zeromq, and Graphite support may belie the use of gmetad and/or gweb; see Chapter 3 for details.)
gmond: Big Bang in a Few Bytes
I hesitate to liken gmond to the “agent” software usually found in more traditional monitoring systems. Like the agents you may be used to, it is installed on every host you want monitored and is responsible for interacting with the host operating system to acquire interesting measurements—metrics such as CPU load and disk capacity. If you examine more closely its architecture, depicted in Figure 1-2, you’ll probably find that the resemblance stops there.
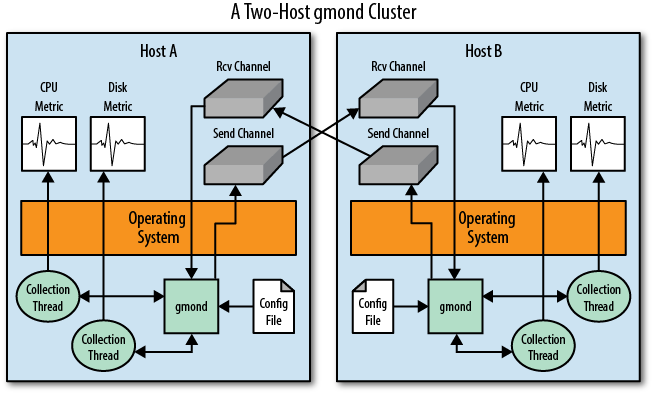
Internally, gmond is modular in design, relying on small, operating system−specific plug-ins written in C to take measurements. On Linux, for example, the CPU plug-in queries the “proc” filesystem, whereas the same measurements are gleaned by way of the OS Management Information Base (MIB) on OpenBSD. Only the necessary plug-ins are installed at compile time, and gmond has, as a result, a modest footprint and negligible overhead compared to traditional monitoring agents. gmond comes with plug-ins for most of the metrics you’ll be interested in and can be extended with plug-ins written in various languages, including C, C++, and Python to include new metrics. Further, the included gmetric tool makes it trivial to report custom metrics from your own scripts in any language. Chapter 5 contains in-depth information for those wishing to extend the metric collection capabilities of gmond.
Unlike the client-side agent software employed by other monitoring systems, gmond doesn’t wait for a request from an external polling engine to take a measurement, nor does it pass the results of its measurements directly upstream to a centralized poller. Instead, gmond polls according to its own schedule, as defined by its own local configuration file. Measurements are shared with cluster peers using a simple listen/announce protocol via XDR (External Data Representation). As mentioned earlier, these announcements are multicast by default; the cluster itself is composed of hosts that share the same multicast address.
Given that every gmond host multicasts metrics to its cluster peers, it follows that every gmond host must also record the metrics it receives from its peers. In fact, every node in a Ganglia cluster knows the current value of every metric recorded by every other node in the same cluster. An XML-format dump of the entire cluster state can be requested by a remote poller from any single node in the cluster on port 8649. This design has positive consequences for the overall scalability and resiliency of the system. Only one node per cluster needs to be polled to glean the entire cluster status, and no amount of individual node failure adversely affects the overall system.
Reconsidering our earlier example of gathering a CPU metric from 20,000 hosts, and assuming that the hosts are now organized into 200 Ganglia clusters of 100 hosts each, gmond reduces the polling burden by two orders of magnitude. Further, for the 200 necessary network connections the poller must make, every metric (CPU, disk, memory, network, etc.) on every individual cluster node is recorded instead of just the single CPU metric. The recent addition of sFlow support to gmond (as described in Chapter 8) lightens the metric collection and polling load even further, enabling Ganglia to scale to cloud-sized networks.
What performs the actual work of polling gmond clusters and storing the metric data to disk for later use? The short answer is also the title of the next section: gmetad, but there is a longer and more involved answer that, like everything else we’ve talked about so far, is made possible by Ganglia’s unique design. Given that gmond operates on its own, absent of any dependency on and ignorant of the policies or requirements of a centralized poller, consider that there could in fact be more than one poller. Any number of external polling engines could conceivably interrogate any combination of gmond clusters within the grid without any risk of conflict or indeed any need to know anything about each other.
Multiple polling engines could be used to further distribute and lighten the load associated with metrics collection in large networks, but the idea also introduces the intriguing possibility of special-purpose pollers that could translate and/or export the data for use in other systems. As I write this, a couple of efforts along these lines are under way. The first is actually a modification to gmetad that allows gmetad to act as a bridge between gmond and Graphite, a highly scalable data visualization tool. The next is a project called gmond-zeromq, which listens to gmond broadcasts and exports data to a zeromq message bus.
gmetad: Bringing It All Together
In the previous section, we expressed a certain reluctance to compare gmond to the agent software found in more traditional monitoring systems. It’s not because we think gmond is more efficient, scalable, and better designed than most agent software. All of that is, of course, true, but the real reason the comparison pains us is that Ganglia’s architecture fundamentally alters the roles between traditional pollers and agents.
Instead of sitting around passively, waiting to be awakened by a monitoring server, gmond is always active, measuring, transmitting, and sharing. gmond imbues your network with a sort of intracluster self-awareness, making each host aware of its own characteristics as well as those of the hosts to which it’s related. This architecture allows for a much simpler poller design, entirely removing the need for the poller to know what services to poll from which hosts. Such a poller needs only a list of hostnames that specifies at least one host per cluster. The clusters will then inform the poller as to what metrics are available and will also provide their values.
Of course, the poller will probably want to store the data it gleans from the cluster nodes, and RRDtool is a popular solution for this sort of data storage. Metrics are stored in “round robin” databases, which consist of static allocations of values for various chunks of time. If we polled our data every 10 seconds, for example, a single day’s worth of these measurements would require the storage of 8,640 data points. This is fine for a few days of data, but it’s not optimal to store 8,640 data points per day for a year for every metric on every machine in the network.
If, however, we were to average thirty 10-second data points together into a single value every 5 minutes, we could store two weeks worth of data using only 4,032 data points. Given your data retention requirements, RRDtool manages these data “rollups” internally, overwriting old values as new ones are added (hence the “round robin” moniker). This sort of data storage scheme lets us analyze recent data with great specificity while at the same time providing years of historical data in a few megabytes of disk space. It has the added benefit of allocating all of the required disk space up front, giving us a very predictable capacity planning model. We’ll talk more about RRDtool in Chapter 3.
gmetad, as depicted in Figure 1-1, is foreshadowed pretty well by the previous few paragraphs. It is a simple poller that, given a list of cluster nodes, will poll each cluster, writing whatever data values are returned for every metric on every host to individual round robin databases.
You’ll recall that “polling” each cluster requires only that the poller open a read socket to the target gmond node’s port 8649, a feat readily accomplished by telnet. Indeed, gmetad could easily be replaced by a shell script that used netcat to glean the XML dump from various gmond nodes and then parse and write the data to RRDtool databases via command-line tools. As of this writing, there is, in fact, already a Python-based replacement for gmetad, which adds a plug-in architecture, making it easier to write custom data-handling logic.
gmetad has a few other interesting features, including the ability to poll data from other gmetad instances, allowing for the creation of federated hierarchal architectures. It includes interactive query functionality and may be polled by external monitoring systems via a simple text protocol on TCP port 8652. Finally, as mentioned in the previous section, gmetad is also capable of sending data to Graphite, a highly scalable data visualization engine.
gweb: Next-Generation Data Analysis
But enough about data collection and storage. I know why you’re really here: visualization. You want graphs that make your data dance, brimming with timely, accurate data and contrasted, meaningful colors. And not just pretty graphs, but a snazzy, well-designed UI to go with them—a UI that is generous with the data, summarizing the status of the entire data center in just a few graphs while still providing quick, easy access to every combination of any individual metrics. It should do this without demanding that you preconfigure anything, and it should encourage you to create your own graphs to explore and analyze your data in any way you can imagine.
If it seems like I’m reading your mind, it’s because the Ganglia authors are engineers like you, who designed Ganglia’s visualization UI, gweb, from their own notion of the ideal data visualization frontend. Quite a bit of thought and real-world experience has gone into its creation, and we think you’ll find it a joy to work with. gweb gives you easy, instant access to any metric from any host in the network without making you define anything. It knows what hosts exist, and what metrics are available for those hosts, but it doesn’t make you click through hierarchal lists of metrics to see graphs; rather, it graphically summarizes the entire grid using graphs that combine metrics by cluster and provides sane click-throughs for increased specificity.
If you’re interested in something specific, you can specify a system name, or a regex or type-glob to combine various metrics from various hosts to create a custom graph of exactly what you want to see. gweb supports click-dragging in the graphs to change the time period, includes a means to easily (and programatically) extract data in various textual formats (CSV, JSON, and more), and sports a fully functional URL interface so that you can embed interesting graphs into other programs via predictable URLs. There are many other features I could mention—so many, in fact, that we’ve dedicated an entire chapter (Chapter 4) to gweb alone, so for now we’ll have to content ourselves with this short description.
Before I move on, however, I should mention that gweb is a PHP program, which most people run under the Apache web server (although any web server with PHP or FastCGI support should do the trick). It is usually installed on the same physical hardware as gmetad, because it needs access to the RRD databases created by the poller. Installation details and specific software requirements are provided in Chapter 2.
But Wait! That’s Not All!
Chapter 2 deals with the installation and configuration of gmond, gmetad, and gweb, and as previously mentioned, Chapter 4 covers gweb’s functionality in more detail, but there’s a lot more to talk about.
We’ve documented everything you might ever want to know about extending Ganglia’s metric-collection functionality in Chapter 5, from easily adding new metrics through shell scripts using gmetric to writing full-fledged plug-ins for gmond in C, C++, or Python. If you’re adept at any of those languages, you should appreciate the thorough documentation of gmond’s internals included herein, written by the implementor of gmond’s modular interface. I personally wish that documentation of this quality had existed when I undertook to write my first gmond module.
Anyone who has spent any time on the Ganglia mailing lists will recognize the names of the authors of Chapter 6. Bernard and Daniel both made the mistake of answering one too many questions on the Ganglia-General list and have hence been tasked with writing a chapter on troubleshooting. If you have a problem that isn’t covered in Chapter 6, odds are you’ll eventually get the answer you’re looking for from either Bernard or Daniel on the Ganglia lists.
Chapter 7 and Chapter 8 cover interoperation with other monitoring systems. Integration with Nagios, arguably the most ubiquitous open source monitoring system today, is the subject of Chapter 7; Chapter 8 covers sFlow, an industry standard technology for monitoring high-speed switched networks. Ganglia includes built-in functionality that enables it to integrate with both of these tools, each of which extend Ganglia’s functionality beyond what would otherwise be a limitation.
Finally, the chapter we’re all most excited to bring you is Chapter 9, wherein we’ve collected detailed descriptions of real-world Ganglia installs from several fascinating organizations. Each case study highlights the varied and challenging monitoring requirements of the organization in question and goes on to describe the Ganglia configuration employed to satisfy them. Any customizations, integration with external tools, and other interesting hurdles are also discussed.
The authors, all of whom are members of and contributors to the Ganglia community, undertook to write this book ourselves to make sure it was the book we would have wanted to read, and we sincerely hope it meets your needs. Please don’t hesitate to visit us online. Until then, we bid you adieu by borrowing the famous blessing from O’Reilly’s sed & awk book: “May you solve interesting problems.”
Get Monitoring with Ganglia now with the O’Reilly learning platform.
O’Reilly members experience books, live events, courses curated by job role, and more from O’Reilly and nearly 200 top publishers.

