Chapter 4. Profiling Perl
Before I can do anything to improve my programs, I have to make a decision about what I am going to fix. Before I spend the time to do that, I want to figure out what I should focus on. How do I get the most improvement for the least amount of fiddling? What should I work on first? Through the process of profiling, by which I record and summarize what a program is doing, I can make those decisions. Luckily, Perl already offers several tools to do this.
Finding the Culprit
I want to compute a factorial. Itâs the old saw of performance discussions, and Iâll get to something more interesting in a moment. When I searched for âfactorial subroutines,â almost every implementation (aside from those in assembly language) was a recursive algorithm, meaning that the subroutine figured out part of the problem, then called itself with a subproblem, and kept doing that until there were no more subproblems, eventually working its way up to the original call. Hereâs how Iâd write that in Perl:
#!/usr/bin/perl
# factorial_recurse.pl

sub factorial {
    return unless int( $_[0] ) == $_[0];
    return 1 if $_[0] == 1;
    return $_[0] * factorial( $_[0] - 1 );
    }

print factorial( $ARGV[0] ), "\n";
Now I want to figure out how to improve this toy program. Itâs
already pretty fast because Perl canât really count that high. With
anything over 170, my program on my machine returns Inf (more on that in a moment). Despite that,
Iâll profile it anyway. I use the Devel::SmallProf module to get a quick summary. I invoke it with the -d switch, which
already assumes the Devel portion of
the name (see Chapter 3):
% perl -d:SmallProf factorial.pl 170I can use the PERL5DB environment
to add code to the program I want to debug. When Devel::SmallProf
loads, it sets everything as before when I use a plain -d switch:
% export PERL5DB='use Devel::SmallProf'% perl -d factorial.pl 170
I can also use the PERL5OPT
environment variable. Whatever is in there is automatically added to the
command-line options:
% export PERL5OPT=-d:SmallProfNo matter which way I call it, the Devel::SmallProf
module leaves behind a human-readable text file named
smallprof.out. In its columnar output, it shows each
line of the program, how many times I executed that line, and the real and
CPU times for each line:
================ SmallProf version 1.15 ================
                 Profile of factorial_recurse.pl                    Page 1
       =================================================================
    count wall tm  cpu time line
        0 0.000000 0.000000     1:#!/usr/bin/perl
        0 0.000000 0.000000     2:
      170 0.000000 0.000000     3:sub factorial {
      170 0.001451 0.000000     4: return unless int( $_[0] ) == $_[0];
      170 0.004367 0.000000     5: return 1 if $_[0] == 1;
      169 0.004371 0.000000     6: return $_[0] * factorial( $_[0] - 1 );
        0 0.000000 0.000000     7: }
        0 0.000000 0.000000     8:
        1 0.000009 0.000000     9:print factorial( $ARGV[0] ), "\n";
To compute the factorial of 170, I had to call the subroutine 170
times. Each time (save for one!) I called that subroutine, I had to
execute the lines in the subroutine. I had to check that the argument was
an integer every time, I had to check if the argument was 1 every time, and in almost every case, I had to
call the subroutine again. Thatâs a lot of work. By profiling my program,
I can see what is taking up all the time, and then concentrate on
improving those areas.
The best way to fix these problems is to come up with a better way
to get the answer. Better algorithms get you better performance than
almost any other method. Instead of using a recursive solution, I changed
it to an iterative one. I can easily get the range of integers using the
range operator, and in other languages, a C-style for loop can stand in:
#!/usr/bin/perl
# factorial_iterate.pl

sub factorial {
    return unless int( $_[0] ) == $_[0];
    my $f = 1;
    foreach ( 2 .. $_[0] ) { $f *= $_ };
    $f;
    }

print factorial( $ARGV[0] ), "\n";
When I profile this program, I see that I did not have to do as much
work. I didnât have as much code to run. I only had to check the argument
once, I didnât have to check if the argument was 1, and I didnât have to make repeated calls to a
subroutine:
================ SmallProf version 1.15 ================
                Profile of factorial2.pl                    Page 1
       =================================================================
    count wall tm  cpu time line
        0 0.000000 0.000000     1:#!/usr/bin/perl
        0 0.000000 0.000000     2:
        1 0.000000 0.000000     3:sub factorial {
        1 0.000021 0.000000     4: return unless int( $_[0] ) == $_[0];
        1 0.000000 0.000000     5: my $f = 1;
      170 0.001632 0.000000     6: foreach ( 2 .. $_[0] ) { $f *= $_ };
        1 0.002697 0.000000     7: $f;
        0 0.000000 0.000000     8: }
        0 0.000000 0.000000     9:
        1 0.000006 0.000000    10:print factorial( $ARGV[0] ), "\n";
Earlier I said that my program topped out at 170. I can get past
that limit by telling Perl to use the bignum pragma:
#!/usr/bin/perl
# factorial_recurse_bignum.pl

use bignum;

sub factorial {
    return unless int( $_[0] ) == $_[0];
    return 1 if $_[0] == 1;
    return $_[0] * factorial( $_[0] - 1 );
    }

print factorial( $ARGV[0] ), "\n";
Now I can see some real performance differences by comparing the factorials of really big numbers. As I was finishing this book, I switched to a MacBook Pro, and its dual-core architecture had no problem with speed in either of the approaches. Only with really large numbers did the recursive approach really slow down.
Thatâs not the whole story, though. Iâve shown a really simple
program that calculates a single number. In a real program I would most
likely use the factorial routine many,
many times with several different values. When I profile the application,
Iâll see the number of times I run the lines of the subroutine throughout
the entire process.
Either approach can benefit from caching its results. Hereâs a program that repeatedly prompts me for a number. It computes the factorial and caches the results along the way, trading memory for speed. The first time I ask it to compute the factorial for 10,000, it takes several seconds. After that, when I ask it for the factorial for any number less than 10,000, itâs just a very fast lookup:
#!/usr/bin/perl
# factorial_iterate_bignum_memo.pl

use bignum;

{
my @Memo      = (1);

sub factorial {
    my $number = shift;

    return unless int( $number ) == $number;
    return $Memo[$number] if $Memo[$number];

    foreach ( @Memo .. $number ) {
        $Memo[$_] = $Memo[$_ - 1] * $_;
        }

    $Memo[ $number ];
    }
}

{
print "Enter a number> ";
chomp( my $number = <STDIN> );
exit unless defined $number;

print factorial( $number ), "\n";
redo;
}
I can do the same with the recursive solution, although the Memoize module does the extra work for me:
#!/usr/bin/perl
# factorial_recurse_bignum_memo.pl

use bignum;

use Memoize;

memoize( 'factorial' );

sub factorial {
    return unless int( $_[0] ) == $_[0];
    return 1 if $_[0] == 1;
    return $_[0] * factorial( $_[0] - 1 );
    }

{
print "Enter a number> ";
chomp( my $number = <STDIN> );
exit unless length $number;

print factorial( $number ), "\n";
redo;
}
While profiling, I must remember that some things in isolation donât tell me the whole story. The profile can help me make decisions, but Iâm the one who has to do the thinking, not the computer.
The General Approach
Profiling means counting, and to count something, I need to make the statements do something so I can count them. I might, for instance, use some of the features from Chapter 3 to add accounting code to my subroutines. Thatâs much too tedious, though. Instead of trying to account for things in individual subroutines, I try to make everything flow through a single control subroutine. This is probably too much for a small program, but in a large system the extra computing pays off in saved developer time when I work on optimizing the program.
The most common place I do this is in database code. In the database case, I want to track with queries I make, usually so I can get an idea of which queries take a long time or which ones I most frequently use. From that, I can figure out what I should optimize.
Hereâs an example of a nexus for all queries that allows me to
profile my database code. Iâve simplified this example, but this is close
to some actual code Iâve used, minus some stuff that doesnât apply to
profiling. I have a package-scoped lexical variable %Queries that will hold my profile data. The
simple_query method is essentially a
wrapper around prepare and execute with some accounting overhead:
package My::Database;

my %Queries;

sub simple_query {
    my( $self, @args ) = @_;

    my $sql_statement = shift @args;

    $Queries{$sql_statement}++;  # <--- Profiling hook

    my $sth = $self->dbh->prepare( $sql_statement );
    unless( ref $sth ) {
        warn "Did not get a statement handle: " . $self->dbh->err;
        return;
        }

    my $rc   = $sth->execute( @args );

    wantarray ? ( $sth, $rc ) : $rc;
    }
In the rest of my database code, I have functions that use simple_query instead of using the DBI interface
directly. My get_postage_rates_by_country subroutine grabs
the amount of postage I need to send mail overseas. It passes the SQL
statement and a bind parameter to simple_query. As before, this is real code,
although Iâve cut out some bits to show only the relevant parts:
sub get_postage_rates_by_country {
    my( $self, $country ) = @_;

    my( $sth ) = $self->simple_query( <<"SQL", $country );
        SELECT
            PostageRates.ounces,
            PostageRates.rate,
            PostageServices.name
        FROM
            PostageRates, Countries, PostageServices
        WHERE
            Countries.pk = ?
        AND
            Countries.usps_zone = PostageRates.usps_zone
        AND
            PostageRates.service = PostageServices.pk
        ORDER BY
            PostageRates.ounces
SQL

    return $sth->fetchall_arrayref;
    }
As my program does its work, the queries flow through simple_query, which counts and records what
happens. To get the profile data, I use an END block to create the report. The particular format depends on what
I collected during the run. In this example I just counted statements, but
I could use that %Queries hash to store
anything I wanted, including the bind parameters, the function that called
simple_query, and so on:
END {
    foreach my $statement ( sort { $b <=> $a } keys %Queries ) {
        printf "%5d %s\n\n", $Queries{$statement}, $statement;
        }
    }
I might find in a long report, for instance, that I repeatedly fetch the postage data for each country, even though itâs not going to change. When I realize Iâm doing this after looking at the profile data, I can optimize my code to cache some of the data in memory rather than asking for the same answer in the database.
Iâve actually been coding my Perl database stuff like this for quite
a while, and I recently found out that Tim Bunce added these features directly to DBI. He did the same sort of thing by making everything flow
through a central function. That was really easy because DBI already
does that for queries.
Profiling DBI
The DBI::Profile module can do much of the same analysis when using Perlâs
database interface module, DBI. Database interactions are often the biggest performance
drain on my programs, and thatâs a place I usually start to look for
improvements. Instead of calling subroutines unnecessarily, as in my last
example, I might be making unnecessary database queries.
Hereâs a short program that takes quite a bit of time because it
makes almost 2,000 database queries. I want to build a table of number
names, so given a digit I can get the name (e.g., 9 has the name âNineâ),
or go from the name to the digit. I should probably use a Lingua::* module, but then I donât want to start
off with something smart. In this example, I use the DBD::CSV module to use a comma-separated value file as my database
store. I create a table to hold the pairs, then start to populate the
table. I bootstrap the data by getting the first 19 names into the table,
then looking up the names I already have to create further names:
#!/usr/bin/perl
# dbi_number_inserter.pl
use strict;

use DBI;

my $dbh = DBI->connect( "DBI:CSV:f_dir=." );

$dbh->do( "DROP TABLE names" );
$dbh->do( "CREATE TABLE names ( id INTEGER, name CHAR(64) )" );

my $sth = $dbh->prepare( "INSERT INTO names VALUES ( ?, ? )" );

my $id = 1;
foreach my $name (
    qw(One Two Three Four Five Six Seven Eight Nine Ten),
    qw(Eleven Twelve Thirteen Fourteen Fifteen Sixteen Seventeen Eighteen
        Nineteen)
    ) {
    $sth->execute( $id++, $name );
    }

foreach my $name ( qw( Twenty Thirty Forty Fifty Sixty Seventy Eighty Ninety ) ) {
    $sth->execute( $id++, $name );

    foreach my $ones_digit ( 1 .. 9 ) {
        my( $ones_name ) = map { lc } $dbh->selectrow_array(
            "SELECT name FROM names WHERE id = $ones_digit"
            );
        $sth->execute( $id++, "$name $ones_name" );
        }
    }

foreach my $digit ( 1 .. 9 ) {
    my( $hundreds ) = $dbh->selectrow_array(
        "SELECT name FROM names WHERE id = $digit"
        );

    $sth->execute( $id++, "$hundreds hundred" );

    foreach my $tens_digit ( 1 .. 99 ) {
        my( $tens_name ) = map { lc } $dbh->selectrow_array(
            "SELECT name FROM names WHERE id = $tens_digit"
            );
        $sth->execute( $id++, "$hundreds hundred $tens_name" );
        }
    }
I run this from the command line, and it takes almost 10 seconds on
my MacBook Air (2011). Thatâs OK; I need a nice, slow example. Now I want
to profile this program to see where I can improve it, pretending I was
just handed it without knowing how it works. I set the DBI_PROFILE environment variable to turn on database profiling. To get a report
ordered by statements, I set DBI_PROFILE='!Statement'. The sort key has an
exclamation point, !, prepended to it.
At the end of the run, I get a long report. Here are the first several lines:
% env DBI_PROFILE='!Statement' perl5.18.1 dbi_number_inserter.pl
DBI::Profile: 10.106893s 101.07% (1982 calls) test.pl @ 2013-09-25 13:34:36
'' =>
    0.000670s / 7 = 0.000096s avg (first 0.000004s, min 0.000004s, max 0.000587s)
'CREATE TABLE names ( id INTEGER, name CHAR(64) )' =>
    0.002444s
'DROP TABLE names' =>
    0.004094s
'INSERT INTO names VALUES ( ?, ? )' =>
    0.402902s / 1001 = 0.000402s avg (first 0.000639s, min 0.000031s
    max 0.000987s)
'SELECT name FROM names WHERE id = 1' =>
    0.108697s / 18 = 0.006039s avg (first 0.002393s, min 0.001790s,
    max 0.016542s)
'SELECT name FROM names WHERE id = 10' =>
    0.088569s / 9 = 0.009841s avg (first 0.003005s, min 0.003005s, max 0.016774s)
'SELECT name FROM names WHERE id = 11' =>
    0.089783s / 9 = 0.009976s avg (first 0.003065s, min 0.003065s, max 0.017336s)
The top line gives me the wall-clock time and the total number of
DBI method
calls; thatâs the number of method calls to DBI, not the
number of queries. After that, I get a report for each query, in lexical
order. Just because it looks like itâs sorted by total time or number of
queries, donât forget to look at the rest of the report. Itâs actually
sorted in alphabetical order of the query.
For each query, DBI::Profile
reports the total wall-clock time and the number of method calls for that
statement. It doesnât report the CPU time because it isnât very
interesting; the database server might be another machine, and even if it
is local, itâs often a separate process. It gives an average time for that
query, and then the times for the first call, the call that took the least
amount of time, and the call that took the most. This isnât as simple as
timing a program. The database server might perform differently given the
same input because it might be doing something else, the data size might
be different, or many other things.
From the full report, I see that most calls took about the same amount of time since they are all running pretty quickly. I canât make a big speed-up by optimizing a query so it performs better on the database. No indexing or rearrangement of joins will likely help here.
What I really need to reduce is the number of queries so I interact
with the database less. I canât get away from the INSERTs since I still have to make each row, but
I donât need to make all of those SELECT statements. I
should cache the result so I donât fetch the same data twice (or even at
all):
#!/usr/bin/perl
# dbi_number_inserter_cached.pl
use strict;

use DBI;

my $dbh = DBI->connect( "DBI:CSV:f_dir=." );

$dbh->do( "DROP TABLE names" );
$dbh->do( "CREATE TABLE names ( id INTEGER, name CHAR(64) )" );

my $insert = $dbh->prepare( "INSERT INTO names VALUES ( ?, ? )" );


my @array = ( qw( Zero ),
    qw(One Two Three Four Five Six Seven Eight Nine Ten),
    qw(Eleven Twelve Thirteen Fourteen Fifteen Sixteen Seventeen Eighteen
        Nineteen)
    );

my $id = 0;
foreach my $name ( @array ) {
    $insert->execute( $id++, $name );
    }

foreach my $name ( qw( Twenty Thirty Forty Fifty Sixty Seventy Eighty Ninety ) ) {
    $array[ $id ] = $name;
    $insert->execute( $id++, $name );
    foreach my $ones_digit ( 1 .. 9 ) {
        my $full_name = $array[ $id ] = "$name $array[$ones_digit]";
        $insert->execute( $id++, $full_name );
        }
    }

foreach my $digit ( 1 .. 9 ) {
    my( $hundreds ) = $array[ $digit ];
    my $name = $array[$id] = "$hundreds hundred";
    $insert->execute( $id++, $name );

    foreach my $tens_digit ( 1 .. 99 ) {
        my( $tens_name ) = lc $array[ $tens_digit ];
        $array[$id] = "$hundreds hundred $tens_name";
        $insert->execute( $id++, "$name $tens_name" );
        }
    }
In my first pass at improvement, I donât have any
SELECT statements at all because I cache the results.
That cuts out most of the runtime in this program. The times for each
program are remarkably different. Remember, however, that Iâve made a
trade-off between speed and memory. The second program is faster, but it
takes up more memory:
% time perl dbi_number_inserter.plreal 0m10.544s user 0m10.402s sys 0m0.137s% time perl dbi_number_inserter_cached.plreal 0m0.637s user 0m0.544s sys 0m0.092s
Hereâs the entire profile report for my new program, which now runs
in 2% of the original runtime. Most of the calls are INSERTs:
% env DBI_PROFILE='!Statement' perl dbi_number_inserter_cached.pl
DBI::Profile: 0.409194s 40.92% (1011 calls) dbi-number-inserter-cached.pl
@ 2013-09-25 13:48:16
'' =>
    0.000676s / 7 = 0.000097s avg (first 0.000004s, min 0.000004s, max 0.000596s)
'CREATE TABLE names ( id INTEGER, name CHAR(64) )' =>
    0.002547s
'DROP TABLE names' =>
    0.004120s
'INSERT INTO names VALUES ( ?, ? )' =>
    0.401851s / 1002 = 0.000401s avg (first 0.000776s, min 0.000062s,
    max 0.000827s)
By looking at the profile, I was able to target part of the program for improvement. It didnât tell me how to improve it, but at least I know where I should spend my time.
Other DBI::Profile Reports
The runtime report isnât the only one I can get. With DBI_PROFILE='!MethodName', DBI orders
the report according to the name of the DBI function.
Itâs in ASCII-betical order with the uppercase
letters sorting before the lowercase ones (and Iâve redacted part of
these reports since they show all of the methods,
including the ones I didnât even know I was using):
% env DBI_PROFILE='!MethodName' perl dbi_number_inserter_cached.pl
DBI::Profile: 0.409558s 40.96% (1011 calls) dbi_number_inserter_cached.pl
@ 2013-09-25 13:49:12
'DESTROY' =>
    0.000063s
'STORE' =>
    0.000024s / 2 = 0.000012s avg (first 0.000004s, min 0.000004s, max 0.000020s)
'connect' =>
    0.000648s
'connected' =>
    0.000008s
'default_user' =>
    0.000014s
'disconnect' =>
    0.000026s
'disconnect_all' =>
    0.000007s
'do' =>
    0.006440s / 2 = 0.003220s avg (first 0.004122s, min 0.002318s, max 0.004122s)
'execute' =>
    0.401549s / 1000 = 0.000402s avg (first 0.000690s, min 0.000382s,
    max 0.000690s)
'prepare' =>
    0.000779s
I can even combine the two, since DBI::Profile
can deal with multiple sort keys if I join them with a colon. With
DBI_PROFILE='!Statement:!MethodName',
DBI gives me
a double-layer report. Under each SQL statement, it breaks the time down
by the particular function it used. I might, for instance, want to
compare the time my database query spends in the DBI guts and
actually fetching the data:
% env DBI_PROFILE='!Statement:!MethodName' perl dbi_number_inserter_cached.pl
DBI::Profile: 0.416383s (1011 calls) dbi_number_inserter_cached.pl @ 2013-09-25
13:54:24
'' =>
    'STORE' =>
        0.000024s / 2 = 0.000012s avg (first 0.000004s, min 0.000004s,
        max 0.000020s)
    'connect' =>
        0.000589s
    'connected' =>
        0.000008s
    'default_user' =>
        0.000013s
    'disconnect' =>
        0.000029s
    'disconnect_all' =>
        0.000007s
'CREATE TABLE names ( id INTEGER, name CHAR(64) )' =>
    'do' =>
        0.002286s
'DROP TABLE names' =>
    'do' =>
        0.004507s
'INSERT INTO names VALUES ( ?, ? )' =>
    'DESTROY' =>
        0.000063s
    'execute' =>
        0.408212s / 1000 = 0.000408s avg (first 0.000671s, min 0.000379s,
        max 0.004499s)
    'prepare' =>
        0.000646s
I can flip that last report around by using DBI_PROFILE='!MethodName:!Statement'. The
first layer lists the DBI method
and then breaks it down by SQL statements after that. See the DBI::Profile
documentation for more examples.
Making It Even Easier
Sam Tregarâs DBI::ProfileDumper module (now maintained by Tim Bunce) does the same thing as DBI::Profile,
but it saves its result in a file instead of dumping it to standard
output.
By default, this file is named dbi.prof, but I can use any name I like. For anything but a small application, Iâll probably have to do quite a bit of custom slicing and dicing to extract the information I need.
First, I tell DBI which
profiling class it should use by including it in the DBI_PROFILE value. I join the class name to
the profiling sort keys with a /:
% env DBI_PROFILE='!Statement'/DBI::ProfileDumper ./program.plOnce that command completes, dbi.prof has all of the profiling data. If I
want to change the filename, I just add that to DBI_PROFILE by
appending it after the class name:
% env DBI_PROFILE='!Statement'/DBI::ProfileDumper/File:dbi.prof ./program.plOnce I have the data, I can analyze them with dbiprof, which has several options to select the data to display, sort it in the way that I want (even on multiple keys), and many other things:
% dbiprof --number all --sort longestSwitching Databases
I started with a pretty bad program that made many unnecessary calls to the database
and did quite a bit of work. I can make that program more Perly, though,
by using Perlâs list operators smartly. Instead of all that index
counting, I use push to put things
onto an array. The code is much tighter and shorter, and it does the
same thing. Instead of inserting items as I go along, I move all the
database stuff to the end (I have secret plans for that later), but for
now the program runs in about the same time as the previous
example:
#!/usr/bin/perl
# dbi_number_inserter_end.pl
use strict;

use DBI;

my @array = ( qw( Zero ),
    qw(One Two Three Four Five Six Seven Eight Nine Ten),
    qw(Eleven Twelve Thirteen Fourteen Fifteen Sixteen Seventeen Eighteen
        Nineteen)
    );

foreach my $name ( qw( Twenty Thirty Forty Fifty Sixty Seventy Eighty Ninety ) ) {
    push @array, $name;
    push @array, map { "$name $array[$_]" } 1 .. 9
    }

foreach my $digit ( 1 .. 9 ) {
    push @array, "$array[$digit] hundred";
    push @array, map { "$array[$digit] hundred $array[$_]" } 1 .. 99;
    }

my $dbh = DBI->connect( "DBI:CSV:f_dir=." );

$dbh->do( "DROP TABLE names" );
$dbh->do( "CREATE TABLE names ( id INTEGER, name CHAR(64) )" );

my $insert = $dbh->prepare( "INSERT INTO names VALUES ( ?, ? )" );

foreach my $index ( 0 .. $#array ) {
    $insert->execute( $index, $array[$index] );
    }
Instead of using a CSV file though, I now want to use a more
sophisticated database server, since I think I might be able to get
better performance in writing all of this stuff to disk. I have the
tools to find out, so why not? Iâll use SQLite, another lightweight server that
DBI can talk to. I donât have to change too much in
my program, since DBI hides all of that for me. I
only change the DBI connection:
# dbi_number_inserter_sqlite.pl
my $dbh = DBI->connect( "DBI:SQLite:dbname=names.sqlite.db" );
When I run my program again, itâs abysmally slow. It takes a lot longer to insert all of these rows into an SQLite database store:
% time perl dbi_number_inserter_sqlite.pl
real    0m1.214s
user    0m0.108s
sys 0m0.547sThatâs awful! When I profile the program, I see that the INSERT statements
take 100 times longer than my previous programs. Outrageous!
% env DBI_PROFILE='!Statement' perl dbi_number_inserter_sqlite.pl
DBI::Profile: 1.139449s 113.94% (1013 calls) dbi_number_inserter_sqlite.pl
@ 2013-09-25 14:01:42
'' =>
    0.000436s / 8 = 0.000055s avg (first 0.000009s, min 0.000001s, max 0.000406s)
'CREATE TABLE names ( id INTEGER, name CHAR(64) )' =>
    0.001244s
'DROP TABLE names' =>
    0.001574s
'INSERT INTO names VALUES ( ?, ? )' =>
    1.136195s / 1003 = 0.001133s avg (first 0.000078s, min 0.000009s,
    max 0.002682s)
But this is a well-known issue with SQLite and some other
databases, because they automatically commit each query and wait for the
data to make it to the physical disk before moving on. Instead of
inserting every row individually, I can do that in a transaction. I
donât have to actually write to the database for every INSERT. Iâll do it all at once when I COMMIT:
# dbi_number_inserter_sqlite_transaction.pl
$dbh->do( "BEGIN TRANSACTION" );
foreach my $index ( 0 .. $#array ) {
    $insert->execute( $index, $array[$index] );
    }
$dbh->do( "COMMIT" );
Now the profile looks much different. Looking at the results, I can see that Iâve improved the insertion time by orders of magnitude, and now itâs faster, by all measures, than any of the previous programs that did the same thing:
%  env DBI_PROFILE='!Statement' perl dbi_number_inserter_sqlite_transaction.pl
DBI::Profile: 0.010383s (1015 calls) dbi_number_inserter_sqlite_transaction.pl
@ 2013-09-25 14:05:14
'' =>
    0.000466s / 8 = 0.000058s avg (first 0.000009s, min 0.000001s, max 0.000434s)
'BEGIN TRANSACTION' =>
    0.000079s
'COMMIT' =>
    0.000943s / 2 = 0.000472s avg (first 0.000870s, min 0.000073s, max 0.000870s)
'CREATE TABLE names ( id INTEGER, name CHAR(64) )' =>
    0.001523s
'DROP TABLE names' =>
    0.001298s
'INSERT INTO names VALUES ( ?, ? )' =>
    0.006074s / 1002 = 0.000006s avg (first 0.000087s, min 0.000004s,
    max 0.000385s)
Devel::NYTProf
Perl comes with a profiler, Devel::DProf, but most Perlers who profile have moved to Devel::NYTProf,
which I can get from CPAN. In the first edition of this book, I
covered Devel::DProf
and we still cover that in Programming
Perl, so I leave that out here.
The mechanics of Devel::NYTProf
are as simple as the other profilers that I show in this chapter. I load
the module with the -d switch and run
the program:
% perl -d:NYTProf program.plThe program runs under that debugger and as it does, Devel::NYTProf
records what it sees, collecting everything in its data files. When the
run is over, I can convert those data files into different formats with
commands that come with the module. For instance, I can convert it for use
with call_grind:
% nytprofcgIf I want to convert it to HTML, I can also have the resulting main HTML file open in my default browser:
% nytprofhtml --openI wonât cover all of this profilerâs features hereâthe documentation and other articles out there already do thatâbut Iâll give you enough to get started by showing off some of the more exciting features.
Writing My Own Profiler
The Devel::SmallProf module from the first examples isnât really all that
complicated. When I look under the hood, I donât see that much code. Itâs
very easy, in fact, to write my own profiler. Some of this same discussion
appeared in my online Dr. Dobbâs Journal article,
âCreating a Perl
Debuggerâ.
Devel::LineCounter
Iâm going to create a profiler to simply count the number of times Perl sees a certain line of code
during the runtime. The Devel::SmallProf
module already does that for me, but once I know how to program the
basics myself, I can adapt it to just about anything that I want to
do.
When I run my program with the -d switch, for each statement Perl calls the
special subroutine &DB::DB (the
default Perl debugger is just a program and works in much the same way).
Thatâs the subroutine named DB in the package
DB. I can do whatever I like in that
subroutine, so Iâm going to accumulate the count of the number of times
Iâve seen that line of code:
package Devel::LineCounter;

package DB;
use strict;
use warnings;

my @counter = ();

sub DB {
    my( $file, $line ) = ( caller )[1,2];

    next unless $file eq $0;

    $counter[$line]++;
    }
To get profiling output without changing my original program, I
add an END block to my
LineCounter module. That will execute
somewhere near the very end of the program, although it might execute
before other END blocks:
END {
    print "\nLine summary for $0\n\n";

    open FILE, $0 or die "Could not open $0\n$!";

    my $count = 0;
    while( <FILE> ) {
        printf "%6d %s", $counter[++$count] || 0, $_;
        }
    }
I store my new module in the right place (i.e., Devel/LineCounter.pm somewhere in Perlâs
module search path), then invoke it with the -d
switch:
% perl -d:LineCounter factorial_iterate.pl 100Profiling Test Suites
The Devel::Cover module profiles my test suites to tell me how much of the
code base they actually test. It counts the number of times the test suite
runs a line of code, as well as keeping track of which code branches I
follow. Ideally, my test should touch every line of code and exercise
every possible set of conditions.
Devel::Cover
Devel::Cover
comes with the cover command, which
reports the coverage statistics for code. To use it, I first clear
anything it might have done before. I donât really need to clear the
coverage data. I might want to add the current run data to what Iâve
already done, or to other coverage databases for other parts of the
project:
% cover -deleteOnce Iâve cleared the coverage database, I run my program after
loading Devel::Cover.
The conventional make test invocation
uses Test::Harness to run each test program, so
I tell Test::Harness
to load Devel::Cover
by setting HARNESS_PERL_SWITCHES
with additional information for the command line to call each test program:
% HARNESS_PERL_SWITCHES=-MDevel::Cover make testI can also use the -test switch with
cover:
% cover -testIf Iâm using Module::Build instead of ExtUtils::MakeMaker, I donât have to do so much work:
% ./Build testcoverJust as with the other Devel::
modules, Devel::Cover
watches as the code runs, and uses a lot of black magic to decide whatâs
going on. It stores all of this information in a directory named
cover_db.
Finally, the cover command
turns all of that data into something that I can understand, writing a
summary to STDOUT and creating a detailed report in
coverage.html. The HTML file links
to several other HTML files, allowing me to drill down into the program.
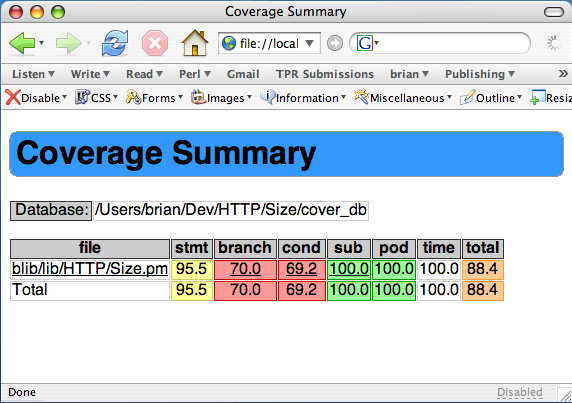
Hereâs a run that analyzes my HTTP::Size module:
% cover
Reading database from /Users/brian/Dev/HTTP/Size/cover_db
---------------------------- ------ ------ ------ ------ ------ ------ ------
File stmt branch cond sub pod time total
---------------------------- ------ ------ ------ ------ ------ ------ ------
blib/lib/HTTP/Size.pm 95.5 70.0 69.2 100.0 100.0 100.0 88.4
Total 95.5 70.0 69.2 100.0 100.0 100.0 88.4
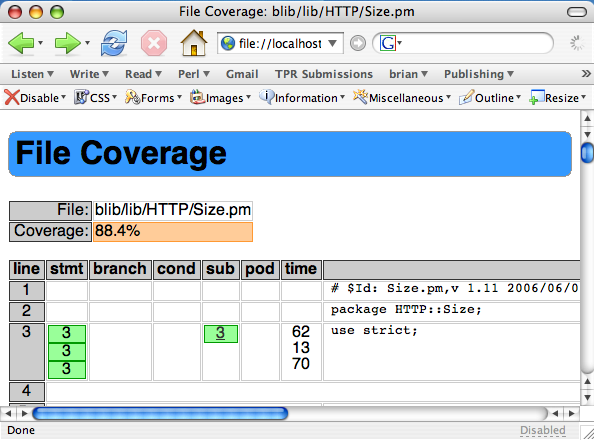
---------------------------- ------ ------ ------ ------ ------ ------ ------The summary shows me that in my test suite Iâve executed 95.5% of the statements in the module. Along with that, Iâve only tested 70% of the possible execution paths and 69.2% of the possible combinations of conditions. Thatâs just the summary, though. The HTML report in coverage.html tells me much more (see Figure 4-1).
The HTML report has columns for each of the types of coverage that it measures, and it colors the table cells green to tell me that I have 100% coverage for that measurement on that line of code, and red to tell me that I have more testing work to do (see Figure 4-2).
Summary
Before I decide how to improve my Perl program, I need to profile it to determine which sections need the most work. Perl profilers are just specialized debuggers, and if I donât like whatâs already out there, I can make my own profiler.
Further Reading
The perldebguts documentation describes creating a custom debugger. I write more about those in my articles for The Perl Journal, âCreating a Perl Debuggerâ and âProfiling in Perlâ.
See âProfiling Perlâ in Chapter 18 of Programming Perl,
4th Edition. It briefly covers Devel::DProf and Devel::NYTProf.
Tim Bunce introduces Devel::NYTProf
in his
presentation from the 2010 YAPC::EU. You can read his NYTProf entries in his
blog.
Perl.com has two interesting articles on profiling: âProfiling Perlâ by Simon Cozens, and âDebugging and Profiling mod_perl Applicationsâ by Frank Wiles.
Randal L. Schwartz writes about profiling for Unix Review, âSpeeding up Your Perl Programsâ, and for Linux Magazine, âProfiling in Template Toolkit via Overridingâ.
Get Mastering Perl, 2nd Edition now with the O’Reilly learning platform.
O’Reilly members experience books, live events, courses curated by job role, and more from O’Reilly and nearly 200 top publishers.

