
Data is everywhere.
Nowadays, everyone has to deal with mounds of data, whether they call themselves “data analysts” or not. But people who possess a toolbox of data analysis skills have a massive edge on everyone else, because they understand what to do with all that stuff. They know how to translate raw numbers into intelligence that drives real-world action. They know how to break down and structure complex problems and data sets to get right to the heart of the problems in their business.
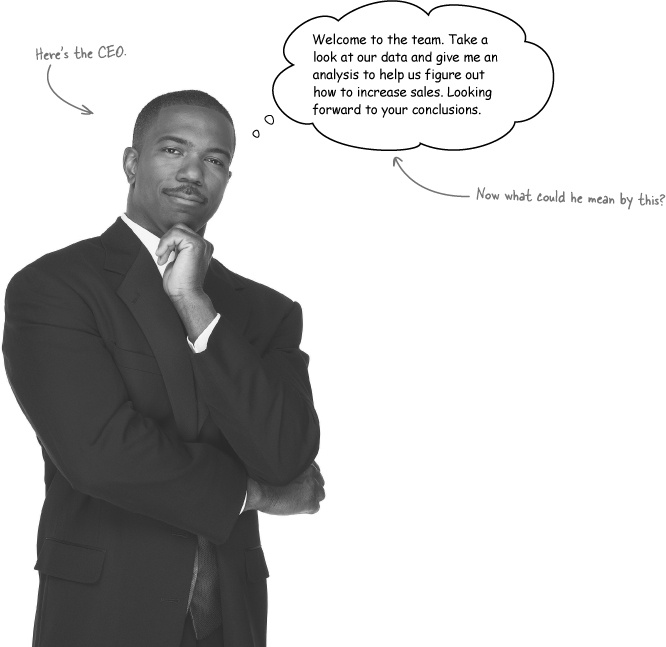
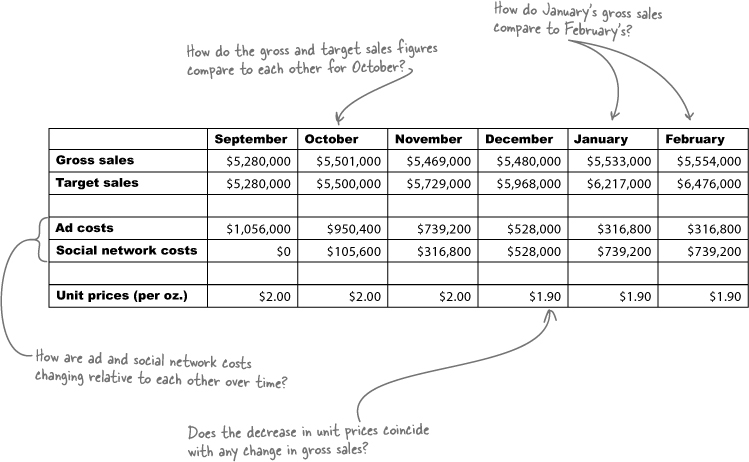
It’s your first day on the job as a data analyst, and you were just sent this sales data from the CEO to review. The data describes sales of Acme’s flagship moisturizer, MoisturePlus.
September | October | November | December | January | February | |
Gross sales | $5,280,000 | $5,501,000 | $5,469,000 | $5,480,000 | $5,533,000 | $5,554,000 |
Target sales | $5,280,000 | $5,500,000 | $5,729,000 | $5,968,000 | $6,217,000 | $6,476,000 |
Ad costs | $1,056,000 | $950,400 | $739,200 | $528,000 | $316,800 | $316,800 |
Social network costs | $0 | $105,600 | $316,800 | $528,000 | $739,200 | $739,200 |
Unit prices (per oz.) | $2.00 | $2.00 | $2.00 | $1.90 | $1.90 | $1.90 |
Take a look at the data. It’s fine not to know everything—just slow down and take a look.
What do you see? How much does the table tell you about Acme’s business? About Acme’s MoisturePlus moisturizer?
Good data analysts always want to see the data.
He wants you to “give him an analysis.”
It’s kind of a vague request, isn’t it? It sounds simple, but will your job be that straightforward? Sure, he wants more sales. Sure, he thinks something in the data will help accomplish that goal. But what, and how?
The expression “data analysis” covers a lot of different activities and a lot of different skills. If someone tells you that she’s a data analyst, you still won’t know much about what specifically she knows or does.
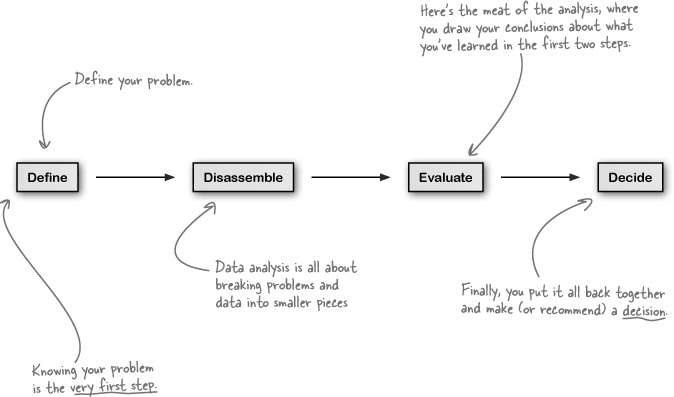
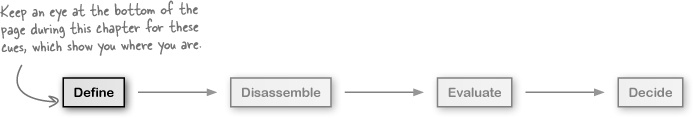
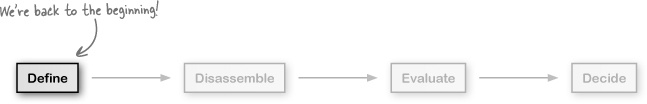
But all good analysts, regardless of their skills or goals, go through this same basic process during the course of their work, always using empirical evidence to think carefully about problems.
In every chapter of this book, you’ll go through these steps over and over again, and they’ll become second nature really quickly.
Ultimately, all data analysis is designed to lead to better decisions, and you’re about to learn how to make better decisions by gleaning insights from a sea of data.
Doing data analysis without explicitly defining your problem or goal is like heading out on a road trip without having decided on a destination.
Sure, you might come across some interesting sights, and sometimes you might want to wander around in the hopes you’ll stumble on something cool, but who’s to say you’ll find anything?
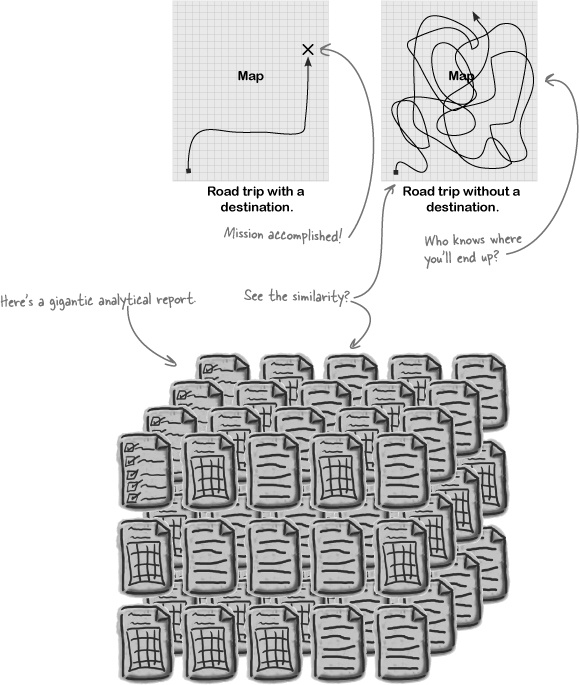
Ever seen an “analytical report” that’s a million pages long, with tons and tons of charts and diagrams?
Every once in a while, an analyst really does need a ream of paper or an hour-long slide show to make a point. But in this sort of case, the analyst often hasn’t focused enough on his problem and is pelting you with information as a way of ducking his obligation to solve a problem and recommend a decision.
Sometimes, the situation is even worse: the problem isn’t defined at all and the analyst doesn’t want you to realize that he’s just wandering around in the data.
How do you define your problem?
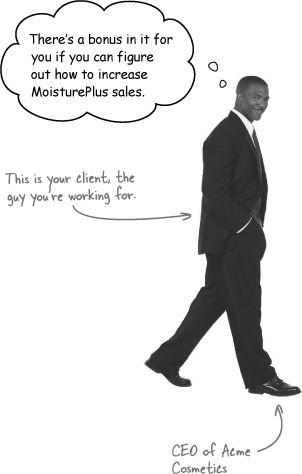
He is the person your analysis is meant to serve. Your client might be your boss, your company’s CEO, or even yourself.
Your client is the person who will make decisions on the basis of your analysis. You need to get as much information as you can from him to define your problem.
The CEO here wants more sales. But that’s only the beginning of an answer. You need to understand more specifically what he means in order to craft an analysis that solves the problem.
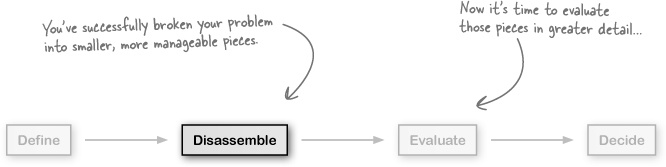
The next step in data analysis is to take what you’ve learned about your problem from your client, along with your data, and break that information down into the level of granularity that will best serve your analysis.
You need to divide your problem into manageable, solvable chunks. Often, your problem will be vague, like this:
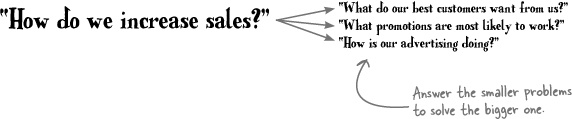
You can’t answer the big problem directly. But by answering the smaller problems, which you’ve analyzed out of the big problem, you can get your answer to the big one.
Same deal with the data. People aren’t going to present you the precise quantitative answers you need; you’ll need to extract important elements on your own.
If the data you receive is a summary, like what you’ve received from Acme, you’ll want to know which elements are most important to you.
If your data comes in a raw form, you’ll want to summarize the elements to make that data more useful.
Let’s give disassembling a shot...
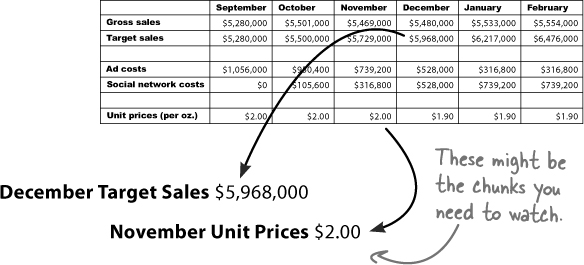
Let’s start with the data. Here you have a summary of Acme’s sales data, and the best way to start trying to isolate the most important elements of it is to find strong comparisons.
Break down your summary data by searching for interesting comparisons.
Making good comparisons is at the core of data analysis, and you’ll be doing it throughout this book.
In this case, you want to build a conception in your mind of how Acme’s MoisturePlus business works by comparing their summary statistics.
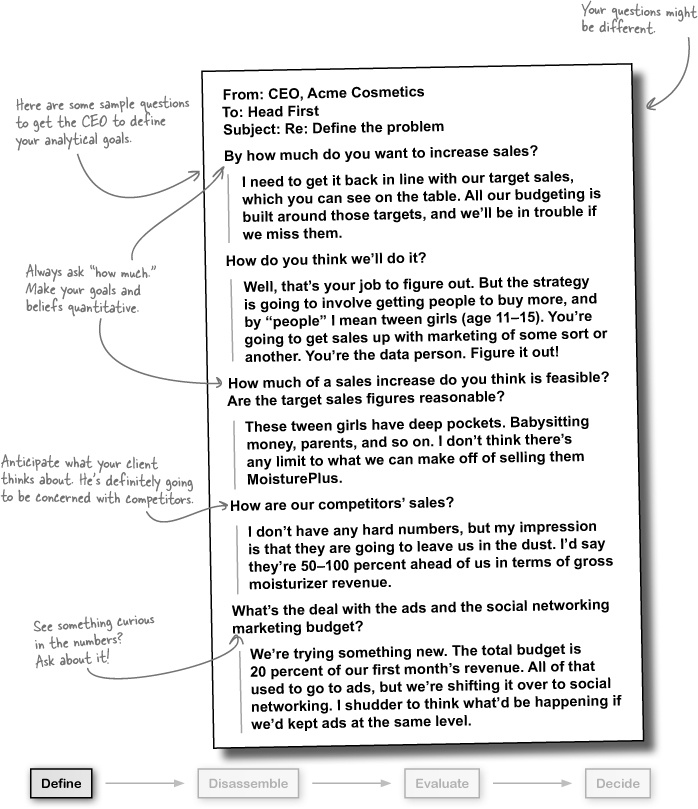
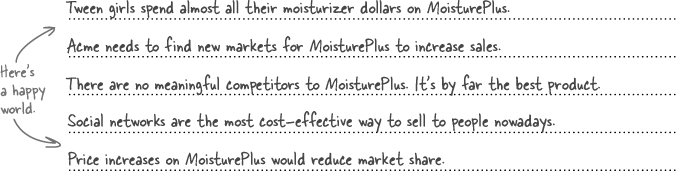
You’ve defined the problem: figure out how to increase sales. But that problem tells you very little about how you’re expected to do it, so you elicited a lot of useful commentary from the CEO.
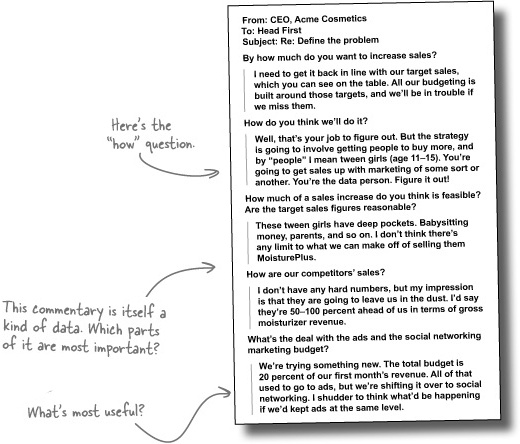
This commentary provides an important baseline set of assumptions about how the cosmetics business works. Hopefully, the CEO is right about those assumptions, because they will be the backbone of your analysis! What are the most important points that the CEO makes?
Here comes the fun part. You know what you need to figure out, and you know what chunks of data will enable you to do it. Now, take a close, focused look at the pieces and form your own judgements about them.
Just as it was with disassembly, the key to evaluating the pieces you have isolated is comparison.
What do you see when you compare these elements to each other?
Observations about the problem | Observations about the data |
|---|---|
|
You have almost all the right pieces, but one important piece is missing...
Inserting yourself into your analysis means making your own assumptions explicit and betting your credibility on your conclusions.
Whether you’re building complex models or making simple decisions, data analysis is all about you: your beliefs, your judgement, your credibility.
As you craft your final report, be sure to refer to yourself, so that your client knows where your conclusions are coming from.
As a data analyst, your job is to empower yourself and your client to make better decisions, using insights gleaned from carefully studying your evaluation of the data.
Making that happen means you have to package your ideas and judgments together into a format that can be digested by your client.
That means making your work as simple as it can be, but not simpler! It’s your job to make sure your voice is heard and that people make good decisions on the basis of what you have to say.
The report you present to your client needs to be focused on making yourself understood and encouraging intelligent, data-based decision making.
Acme Cosmetics Analytical Report
MoisturePlus customers are tween girls (where tweens are people aged 11–15). They’re basically the only customer group. Acme is trying out reallocating expenses from advertisements to social networking, but so far, the success of the initiative is unknown. We see no limit to potential sales growth among tween girls. Acme’s competitors are extremely dangerous.
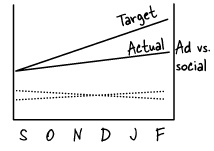
Interpretation of data
Sales are slightly up in February compared to September, but kind of flat. Sales are way off their targets. Cutting ad expenses may have hurt Acme’s ability to keep pace with sales targets. Cutting the prices does not seem to have helped sales keep pace with targets.
Recommendation
It might be that the decline in sales relative to the target is linked to the decline in advertising relative to past advertising expenses. We have no good evidence to believe that social networking has been as successful as we had hoped. I will return advertising to September levels to see if the tween girls respond. Advertising to tween girls is the way to get gross sales back in line with targets.
What will the CEO think?
Your report is concise, professional, and direct.
It speaks to the CEO’s needs in a way that’s even clearer than his own way of describing them.
You looked at the data, got greater clarity from the CEO, compared his beliefs to your own interpretation of his data, and recommended a decision.
Nice work!

How will your recommendation affect Acme’s business?
Will Acme’s sales increase?
On the face of it, this sounds good for Acme. But if the market’s saturated, more ads to tween girls probably won’t do much good.
It’s hard to imagine the tween girl campaign would have worked. If the overwhelming majority of them are using MoisturePlus two or more times a day, what opportunity is there for increasing sales?
You’ll need to find other opportunities for sales growth. But first, you need to get a handle on what just happened to your analysis.

Here’s what the CEO said about how MoisturePlus sales works:
Take a look at how these beliefs fit with the data. Do the two agree or conflict? Do they describe different things?
September | October | November | December | January | February | |
|---|---|---|---|---|---|---|
Gross sales | $5,280,000 | $5,501,000 | $5,469,000 | $5,480,000 | $5,533,000 | $5,554,000 |
Target sales | $5,280,000 | $5,500,000 | $5,729,000 | $5,968,000 | $6,217,000 | $6,476,000 |
Ad costs | $1,056,000 | $950,400 | $739,200 | $528,000 | $316,800 | $316,800 |
Social network costs | $0 | $105,600 | $316,800 | $528,000 | $739,200 | $739,200 |
Unit prices (per oz.) | $2.00 | $2.00 | $2.00 | $1.90 | $1.90 | $1.90 |
The data doesn’t say anything about tween girls. He assumes that tween girls are the only buyers and that tween girls have the ability to purchase more MoisturePlus.
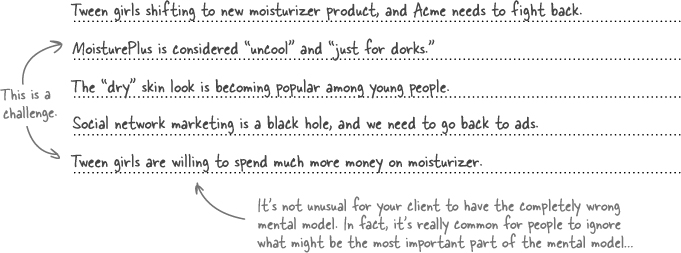
And in this case, it’s problematic. If the newspaper report is true, the CEO’s beliefs about tween girls are wrong. Those beliefs are the model you’ve been using to interpret the data.
The world is complicated, so we use mental models to make sense of it. Your brain is like a toolbox, and any time your brain gets new information, it picks a tool to help interpret that information.
Mental models can be hard-wired, innate cognitive abilities, or they can be theories that you learn. Either way, they have a big impact on how you interpret data.
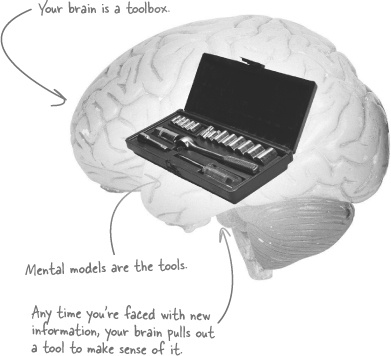
Sometimes mental models are a big help, and sometimes they cause problems. In this book, you’ll get a crash course on how to use them to your advantage.
What’s most important for now is that you always make them explicit and give them the same serious and careful treatment that you give data.
Always make your mental models as explicit as possible.
Mental models determine what you see. They’re your lens for viewing reality.

You can’t see everything, so your brain has to be selective in what it chooses to focus your attention on. So your mental model largely determines what you see.

If you’re aware of your mental model, you’re more likely to see what’s important and develop the most relevant and useful statistical models.
Your statistical model depends on your mental model. If you use the wrong mental model, your analysis fails before it even begins.
You’d better get the mental model right!
Sharpen your pencil Solution
You just looked at your summary data with a new perspective: how would different mental models fit?
September | October | November | December | January | February | |
|---|---|---|---|---|---|---|
Gross sales | $5,280,000 | $5,501,000 | $5,469,000 | $5,480,000 | $5,533,000 | $5,554,000 |
Target sales | $5,280,000 | $5,500,000 | $5,729,000 | $5,968,000 | $6,217,000 | $6,476,000 |
Ad costs | $1,056,000 | $950,400 | $739,200 | $528,000 | $316,800 | $316,800 |
Social network costs | $0 | $105,600 | $316,800 | $528,000 | $739,200 | $739,200 |
Unit prices (per oz.) | $2.00 | $2.00 | $2.00 | $1.90 | $1.90 | $1.90 |
Always specify uncertainty. If you’re explicit about uncertainty, you’ll be on the lookout for ways to use data to fill gaps in your knowledge, and you will make better recommendations.
Thinking about uncertainties and blind spots can be uncomfortable, but the payoff is huge. This “anti-resume” talks about what someone doesn’t know rather than what they do know. If you want to hire a dancer, say, the dances they don’t know might be more interesting to you than the dances they do know.
It’s the same deal with data analysis. Being clear about your knowledge gaps is essential.
Specify uncertainty up front, and you won’t get nasty surprises later on.
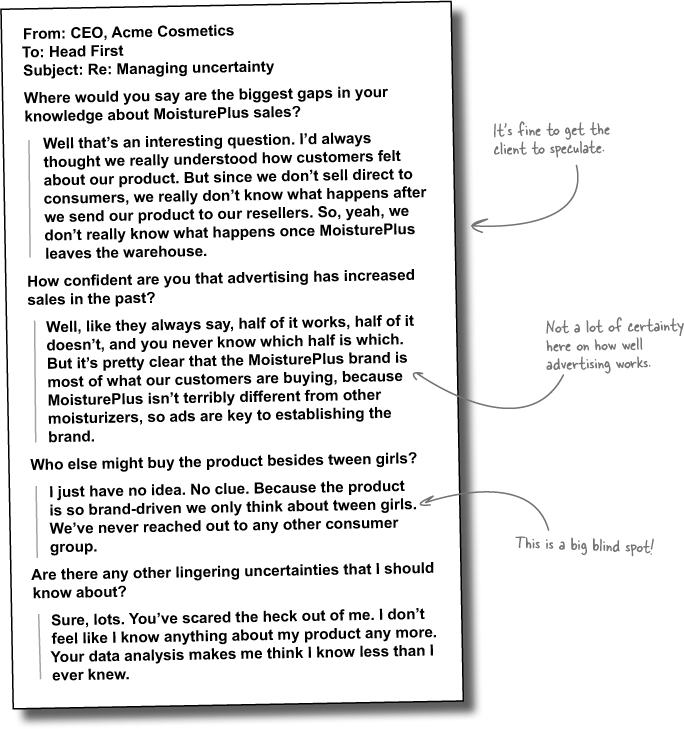
Who else might be buying MoisturePlus?
Are there other buyers besides tween girls?
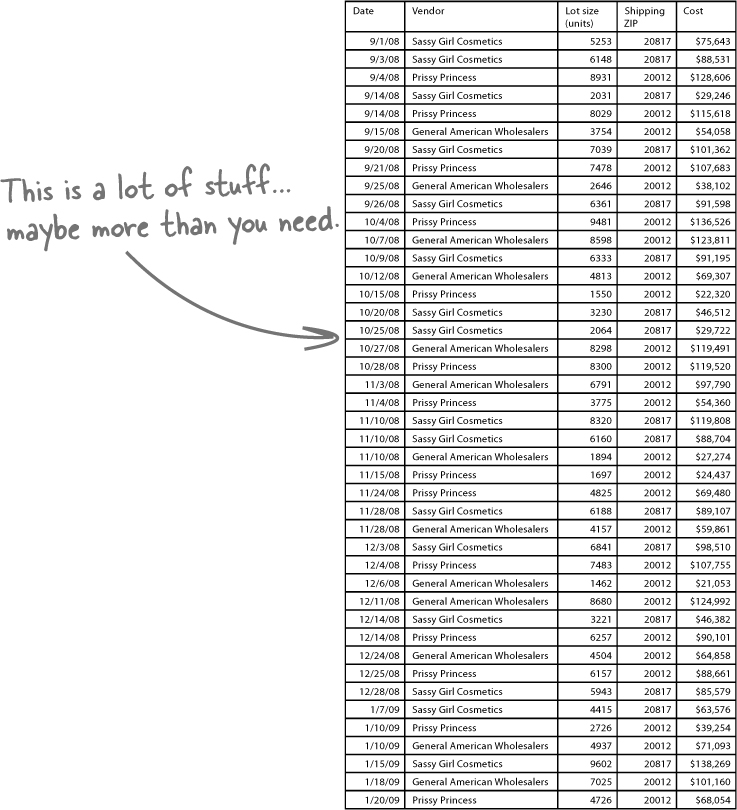
The CEO ordered more data to help you look for market segments besides tween girls. Let’s take a look.
When you get new data, and you haven’t done anything to change it yet, it’s considered raw data. You willl almost always need to manipulate data you get from someone else in order to get it into a useful form for the number crunching you want to do.
Just be sure to save your originals. And keep them separate from any data manipulation you do. Even the best analysts make mistakes, and you always need to be able to compare your work to the raw data.

Relax
A lot of data is usually a good thing.
Just stay focused on what you’re trying to accomplish with the data. If you lose track of your goals and assumptions, it’s easy to get “lost” messing around with a large data set. But good data analysis is all about keeping focused on what you want to learn about the data.
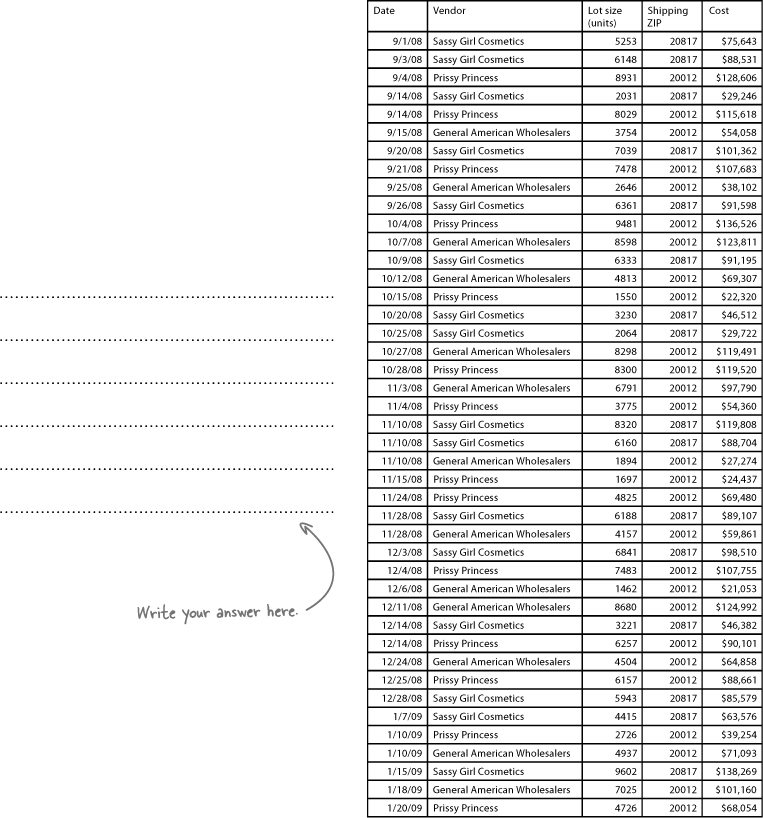
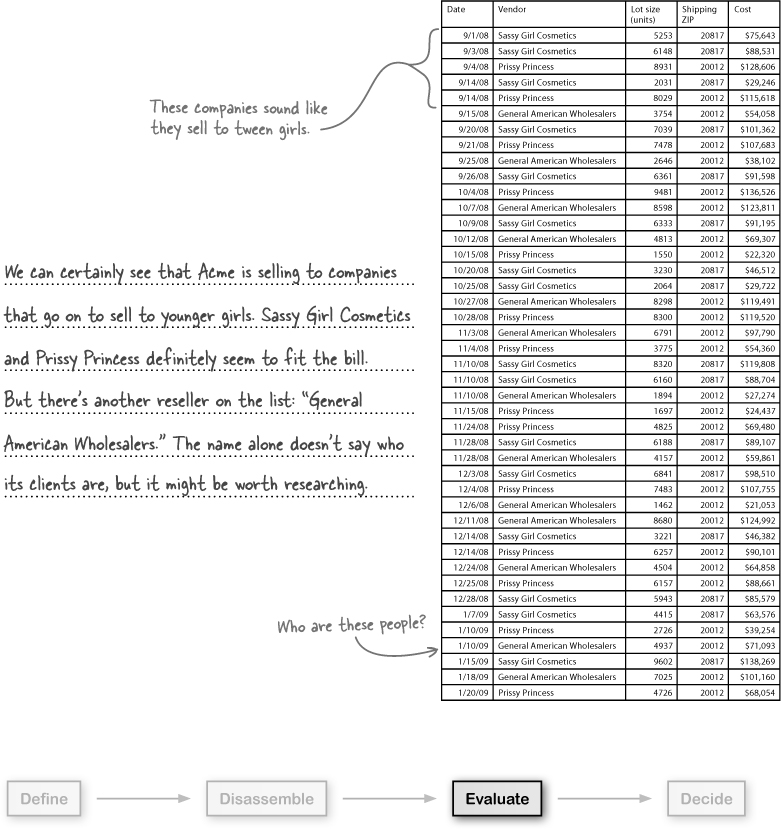
You looked at the mass of data with a very clear task: find out who’s buying besides tween girls.
You found a company called General American Wholesalers. Who are they? And who’s buying from them?
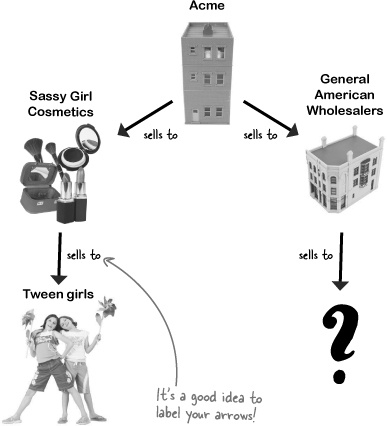

This could be huge.
It looks like there’s a whole group of people out there buying MoisturePlus that Acme hasn’t recognized.
With any luck, this group of people could be where you have the potential to grow Acme’s sales.

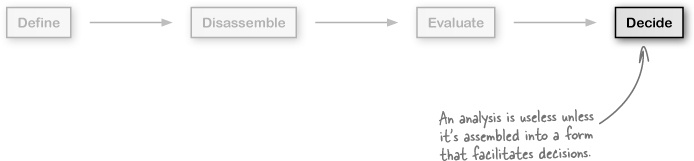
You’ve made it to the final stage of this analysis.
It’s time to write your report. Remember, walk your client through your thought process in detail. How did you come to the insights you’ve achieved?
Finally, what do you suggest that he do to improve his business on the basis of your insights? How does this information help him increase sales?
Here’s one last look at the steps you’ve gone through to reach your conclusion about how to increase the sales of Acme’s MoisturePlus.


After he received your report, the CEO quickly mobilized his marketing team and created a SmoothLeather brand moisturizer, which is just MoisturePlus under a new name.
Acme immediately and aggressively marketed SmoothLeather to older men. Here’s what happened:
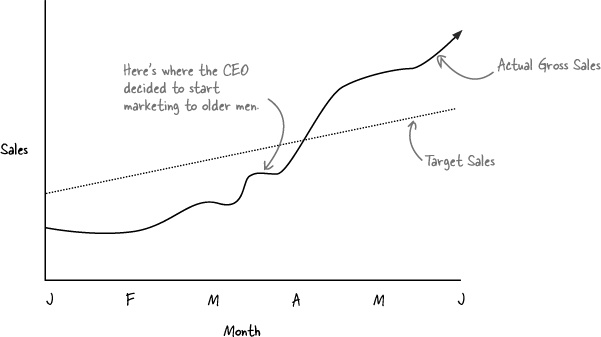
Sales took off! Within two months sales figures had exceeded the target levels you saw at the beginning of the chapter.
Looks like your analysis paid off!
Get Head First Data Analysis now with the O’Reilly learning platform.
O’Reilly members experience books, live events, courses curated by job role, and more from O’Reilly and nearly 200 top publishers.

