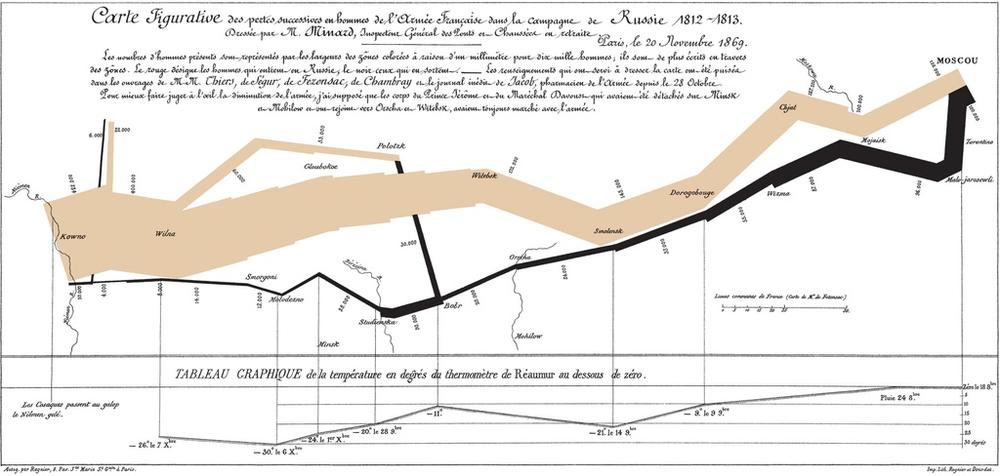
Visualizing data is now an old trade. We have, in one way or another, been visualizing collected data for a long timeâthe year of this writing is the 143rd birthday of Minardâs famous Napoleonâs March flow map shown in Figure 1-1. Lately, though, weâve gone into overdrive, as the amount of data we capture increases without bound and our ability to glean insights from it develops and matures. The Internet, combined with the latest generation of browsers, gives us a fantastic opportunity to take our urge to visualize to the next level: to create live, interactive graphics that have the opportunity to reach millions of people.
JavaScript is the language of the modern browser. As such, it is the most installed language in the world: the one language you can be confident is installed on the userâs computer. Similarly, all modern browsers (with the introduction of IE9 in 2011) can render Scalable Vector Graphics (SVG), including mobile devices that are unable to render Flash. Together, the combination of JavaScript and SVG allows us to create sophisticated charts that are accessible by a majority of Internet users. And, thanks to D3, bringing these technologies together is a straightforward task.
D3 is a JavaScript library written by Mike Bostock, created as a
successor to an earlier visualization toolkit called Protovis. The D3
library allows us to manipulate elements of a web page in the context of a
data set. These elements can be HTML, SVG, or Canvas elements, and can be
introduced, removed, or edited according to the contents of the data set.
So, for example, to create a scatter graph, we use D3 to arrange SVG
circle elements such that their
cx and cy attributes are set to the x- and y-values of
the elements in a data set, scaled to map from their natural units into
pixels.
A huge benefit of how D3 exposes the designer directly to the web page is that the existing technology in the browser can be leveraged without having to create a whole new plotting language. This appears both when selecting elements, which is performed using CSS selectors (users of JQuery will find many of the idioms underlying D3 very familiar), and when styling elements, which is performed using normal CSS. This allows the designer to use the existing tools that have been developed for web designâmost notably Firefoxâs Firebug and Chromeâs Developer Tools.
Instead of creating a traditional visualization toolkit, which typically places a heavy wrapper between the designer and the web page, D3 is focused on providing helper functions to deal with mundane tasks, such as creating axes and axis ticks, or advanced tasks such as laying out graph visualizations or chord diagrams. This means that, once over D3âs initial learning curve, the designer is opened up to a very rich world of modern, interactive and animated data visualization.
The D3 library can be downloaded from http://d3js.org. It will be assumed that the d3.js file lives in the folder that contains the HTML for each example.
All the examples in this book rely on a common HTML and JavaScript structure, which is shown in Example 1-1.

The D3 library is always included to give our visualizations access to the D3 methods.

The rest of the book will focus on this function, which we will always call
draw. This is a function with one argument; it is called once the data has been downloaded to the client. It will contain the bulk of the code necessary to create the visualization.
All the JavaScript will satisfy the JSLint tool, available at http://www.jslint.com/. D3 encourages the use of the âcascadeâ JavaScript coding style, making it easy to write well-formed JavaScript. The
"use
        strict";
line instructs the browser to apply a strict interpretation of the JavaScript rules which, by making us write cleaner code, allows us to avoid confusing bugs.
The
d3.json()function makes an HTTP GET request to a JSON file at the URL described by its first argument and once the data has been downloaded, will then call the function passed as the second argument. This second argument is a callback function (which we will always calldraw), which is passed, as its only parameter, the contents of the JSON having been turned into an object or an array, whichever is appropriate. Although D3 can read both XML and CSV, we remain constant throughout the book and stick to JSON.
The approach taken in this book is to expose the reader to the process of building up the visualizations. This means that the first few steps of the process can result in some ugly, incomprehensible pages, which are subsequently styled into shape. As such, all the CSS is detailed in the examples and tends to be explained after the elements of the visualization have been specified.
New York is an incredibly large, incredibly dense city with a lot of people constantly moving around. As such, it has evolved an intricate transport network, large parts of which are managed by the Metropolitan Transit Authority (MTA). The MTA is responsible for the local trains, subways, buses, bridges, and tunnels that move over 11 million people a day through the five boroughs and beyond.
The MTA has made a large amount of data associated with the running of this network publicly available. This has, in turn, generated a vibrant developer community that is able to build on top of this data that enable the residents of NYC to interact more efficiently with the transport network their tax dollars support.
We will use this data as inspiration for each example in this book. Each of the examples herein use one or more data files released by the MTA, which can be found at http://www.mta.info/developers/. This is a great resource that, as well as providing up-to-date data sets, also points to the invaluable user group that has formed around this data.
The source code associated with this book lives in two
directories, links to which can be found on the bookâs catalog page. The /code directory holds Python code that
converts the MTA data, which is in many different formats, to
well-formed JSON. Processing the data is not the focus of this book, and
the examples can be followed without needing to run or understand the
Python code. This code also has the potential to go out of date as the
MTA updates its data files.
Warning
D3 is not a great tool for cleaning data. In general, while it is certainly possible to use JavaScript to clean up data, it is not wise to perform this on the client machine in the browser. For this book Python has been used to clean up the data prior to developing the visualizations as it has many mature tools for parsing XML, CSV, and JSON, and is an all around good tool for this sort of thing.
The /viz folder holds the HTML
files for each visualization. We shall focus on this section of the code
for the rest of the book. The cleaned up JSON data is stored in /viz/data. Some of these files are quite
large, so be warned before loading them up in a text editor!
Note
Time spent forming clean, well-structured JSON can save you a lot of heartache down the road. Make sure any JSON you use satisfies http://jsonlint.com at the very least. Performing cleaning or data analysis in the browser is not only a frustrating programming task, but can also make your visualization less responsive.
As noted above, d3.json() makes
HTTP GET requests to a web server. We therefore need a web server
running to handle these requests and serve up our JSON. A simple way of
solving this is to use Pythonâs SimpleHTTPServer to serve up all the HTML and
JSON files to the browser. On Linux and OS X, you almost definitely have
Python installed. On Windows, you can download Python from http://python.org.
To start up the server, use a terminal (Linux or OS X) or command
prompt (Windows) to navigate to the viz folder and type the following:
python-mSimpleHTTPServer8000
This starts up an HTTP server on port 8000. If you open up a
browser and point it at http://localhost:8000, you
will see all the example HTML files for this book, as well as the
data directory that contains all the
cleaned up JSON files.
Note
There are any number of ways of serving HTTP files; using Python is a pretty simple cross-platform approach.
Having started an HTTP server, all the requests for data we make
will be to this server, which will happily serve up the data. By keeping
our paths relative to the viz folder
we will be able to transplant any code we write to a more serious
production server to share what we write with the world.
Get Getting Started with D3 now with the O’Reilly learning platform.
O’Reilly members experience books, live events, courses curated by job role, and more from O’Reilly and nearly 200 top publishers.

