By now, you must have noticed that there's a nice little command
prompt in Firebug that appears whenever the Console tab is selected. In
a nutshell, this little command prompt, shown in Figure A-6, will execute whatever
JavaScript you throw at it. Use it to test out JavaScript concepts, or
reach in and grab references to nodes for instant quick manipulation. In
particular, you can grab references to any content in the page through
JavaScript's document.getElementById
function. So what if an element doesn't have an id valueâgive it one yourself and be on your
merry way. From there, you might choose to use the console's built-in
console.dir (just like in Python) to
reveal methods available to it. Now would be a good time to divert to
Firebug's documentation (http://getfirebug.com/docs.html), where you'll find
details about console, incredibly
useful built-in functions like dir,
and more.
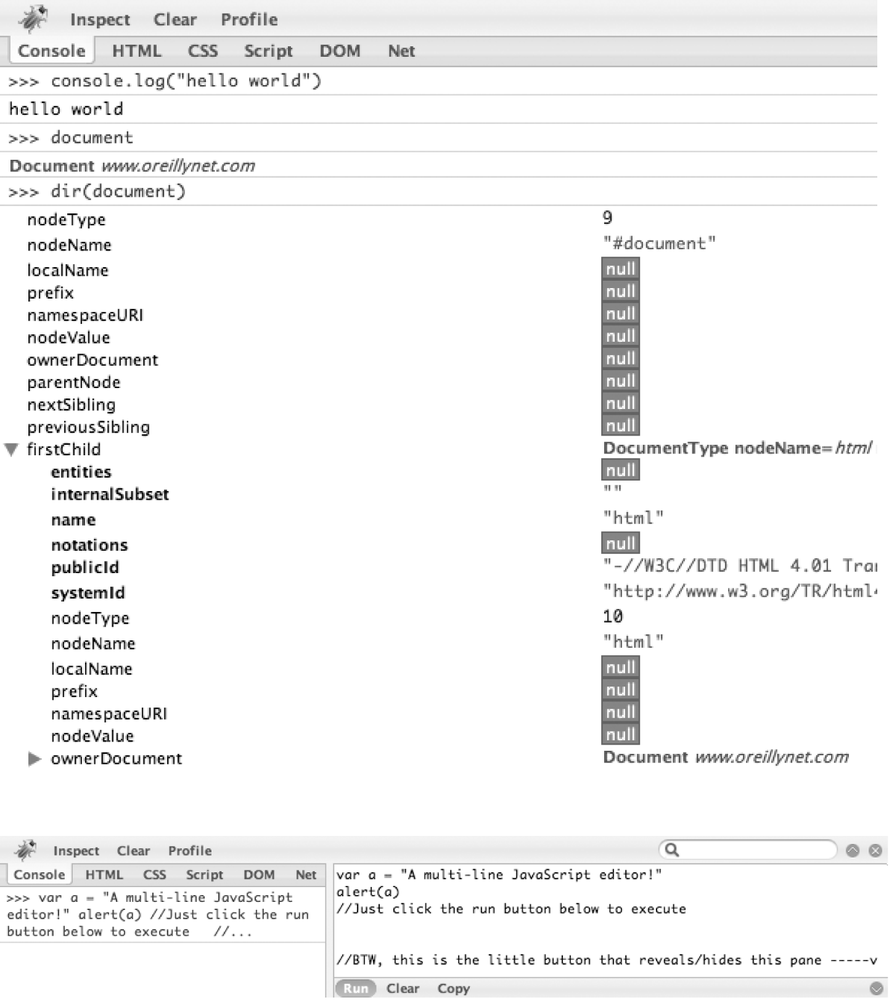
Figure A-6. Left: the console is your scripting interface into any web page; right: clicking the subtle button that looks like a ^ on the far right of the console prompt reveals a multiline JavaScript editor
Another contextual button that's visible while the Console tab is selected is Profile, and it does exactly what you'd think: profiles the execution of JavaScript in the page, as shown in Figure A-7. You simply click on it once to start profiling and click on it again to stop profiling and display a summary of the statistics collected. Can it get any easier than that? The snapshot below is from http://jobs.oreilly.com, and displays some JavaScript stats related to clicking on the navigation bar that appears on the left side of that page.
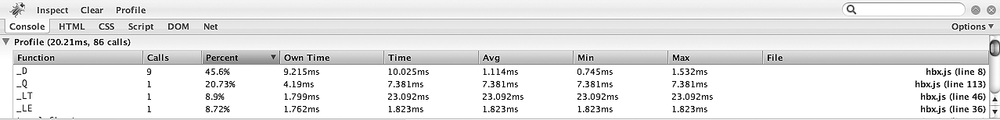
Figure A-7. Firebug comes with an incredible profiler that gives you all sorts of handy stats about the performance of JavaScript in web pages
It's especially noteworthy that Dojo binds tightly with Firebug.
When it loads in Firefox, the console is available for dropping output
that's great for debugging or status messages via the console.log function, and on other browsers,
Firebug Lite (a minimalist console) still logs output and allows you to
interact with the DOM.
Because console.log is by far
the most commonly used function for debugging, it's helpful to know that
you should separate items you'd like to log instead of other approaches
such as concatenating them together. The reason is that Firebug allows
you to inspect items by clicking on them, and if you implicitly convert
them to a String you lose this
benefit. For example, you might log a status message about a variable
called foo as console.log("the value of foo is", foo) in
order to be able to introspect foo.
If you were to instead use console.log("the
value of foo is "+foo), you'd be stuck with a String. It may not matter for primitives, but
if foo were a complex Object, you want the benefit of
introspection.
Get Dojo: The Definitive Guide now with the O’Reilly learning platform.
O’Reilly members experience books, live events, courses curated by job role, and more from O’Reilly and nearly 200 top publishers.

