Chapter 1. What Do We Mean by Data-Driven?
Without data you’re just another person with an opinion.
William Edwards Deming
Data-drivenness is about building tools, abilities, and, most crucially, a culture that acts on data. This chapter will outline what sets data-driven organizations apart. I start with some initial prerequisites about data collection and access. I then contrast reporting and alerting versus analyses in some detail because it is such an important distinction. There are many different types of forward-looking analysis, varying in degrees of sophistication. Thus, I spend some time going over those types, describing them in terms of “levels of analytics” and “analytics maturity,” in particular, discussing the hallmarks of an analytically mature organization. What does that look like?
Let us start us on the way to answering our first question: what does it mean for an organization to be data-driven?
Data Collection
Let’s get a couple of obvious prerequisites out of the way.
Prerequisite #1: An organization must be collecting data.
Data undoubtedly is a key ingredient. Of course, it can’t just be any data; it has to be the right data. The dataset has to be relevant to the question at hand. It also has to be timely, accurate, clean, unbiased; and perhaps most importantly, it has to be trustworthy.
This is a tall order. Data is always dirtier than you imagine. There can be subtle hidden biases that can sway your conclusions, and cleaning and massaging data can be a tough, time-consuming, and expensive operation. I often hear that data scientists spend 80% of their time obtaining, cleaning, and preparing data, and only 20% of their time building models, analyzing, visualizing, and drawing conclusions from that data (for example, http://bit.ly/nyt-janitor and http://bit.ly/im-data-sci). In my experience, this is entirely plausible. In the next chapter, I’ll cover aspects of data quality in much more detail.
Even if you do have quality data, and even if you have a lot of quality data, you will only get so far and; despite the hype that you might hear, it does not make you data-driven. Some people, especially certain big data vendors and service providers, pimp big data as a panacea: if you collect everything, somewhere in there are diamonds (or golden nuggets or needles or one of many other metaphors) that will make any company successful. The hard truth is that data alone is not enough. A small amount of clean, trustworthy data can be far more valuable than petabytes of junk.
Data Access
Prerequisite #2: Data must be accessible and queryable.
Having accurate, timely, and relevant data, though, is not sufficient to count as data-driven. It must also be:
- Joinable
-
The data must be in a form that can be joined to other enterprise data when necessary. There are many options, such as relational databases, NoSQL stores, or Hadoop. Use the right tool for the job. For instance, for a long while, the financial analysts at Warby Parker were using Excel to compute the key metrics reported to senior management. They sucked down huge amounts of raw data from different sources and ran VLOOKUPS (an Excel function to find cross-references in the data) to join all that data to get a top-level look at the numbers. This worked well initially, but as the company’s sales and customer base were scaling rapidly, the data got larger and larger, the Excel file approached 300 MB, their computers maxed out their RAM, and the VLOOKUPS would take 10 hours or more, frequently crash, and had to be restarted. They had stretched the tool and approach as far as they could go. Excel had been an appropriate tool, but company hypergrowth changed that. The mechanics of getting those numbers became a huge time-sink for the analysts and a source of stress as to whether they would get their numbers or have to wait another 10 hours to rerun those VLOOKUPS. It turned them from analysts into Microsoft data engineers. My team helped to bring that whole dataset into a MySQL relational database. We wrote queries to crunch the numbers for them, allowing them to focus on analysis, trends, and presentation of that data—a far better use of their time. Now that they have better tools and more time, they are producing deeper, richer analyses.
- Shareable
-
There must be a data-sharing culture within the organization so that data can be joined, such as combining customers’ clickstream with their transactional history. Imagine a patient admitted to a hospital ER, receiving treatment and then being released with a requirement to attend an outpatient clinic for additional treatment and checkups. The patient is going to receive worse customer service and more importantly worse care if the hospital and clinic don’t share data—when, where, and why was he admitted, what issues did he present, what treatment did he receive, etc. From the healthcare providers’ perspective, their analysts are going to find it hard or impossible to analyze and improve the process and care if they don’t have a coherent, accurate picture of patient flow, diagnostic processes, and complete longitudinal data of those patients. So, siloed data is always going to inhibit the scope of what can be achieved. When more data is available to more parts of a system, the whole is greater than the sum of the parts.
- Queryable
-
There must be appropriate tools to query and slice and dice the data. All reporting and analysis requires filtering, grouping, and aggregating data to reduce the large amounts of raw data into a smaller set of higher-level numbers that help our brains comprehend what is happening in a business. I need to be able to see trends or understand differences among customer segments. Analysts have to have tools that allow them to compute those metrics relatively easily.
(All of these topics will be covered in greater detail in later chapters.)
OK, so now we have data and it is accessible. Is this sufficient? No, not yet. You need people with the right skills to use that data. That can mean the mechanics of filtering and aggregating data, such as through a query language or Excel macros, but it also means people who design and choose the appropriate metrics to extract and track (this topic is covered in Chapter 6). Those metrics might be resubscription rates (for subscription services such as Netflix or the Wall Street Journal), lifetime values, or growth metrics, but someone needs to decide upon them and someone (else) needs to create some process to provide those values.
So, for an organization to be data-driven, there have to be humans in the loop, humans who ask the right questions of the data, humans who have the skills to extract the right data and metrics, and humans who use that data to inform next steps. In short, data alone is not going to save your organization.
Reporting
Let’s suppose you have an analytical group with access to accurate data. The group extracts sales data and generates a report proudly claiming that the company’s bookings grew 5.2% from April to May (Figure 1-1).
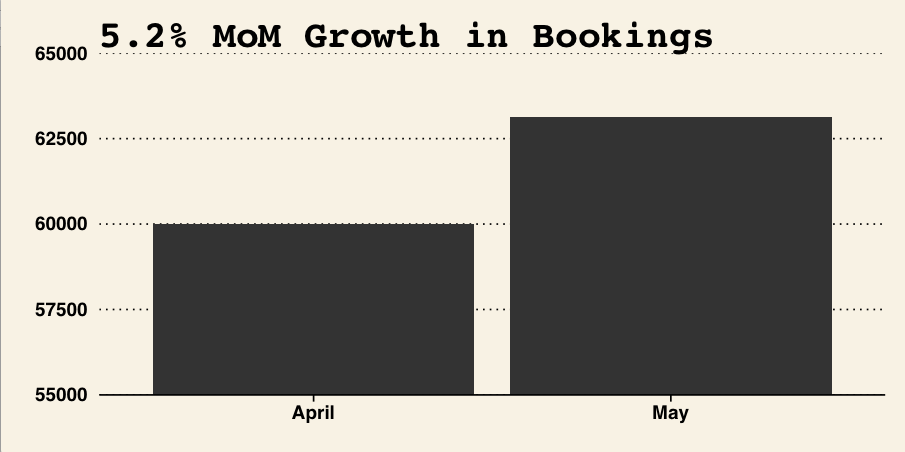
Figure 1-1. 5.2% month-over-month sales growth!
This is certainly now sounding more like a data-driven company. However, this is still deeply insufficient. Certainly it is good that they are tracking these metrics. The CFO and CEO will definitely be interested in those numbers. What, however, does this value of 5.2% really tell you? Very little, in fact. There are many possible reasons why the company sales grew by this amount:
- Suppose that you sell a highly seasonal product, such as beachwear. Maybe 5.2% is much lower than normal. Maybe most years, May’s growth is more than 7% over the prior month and this year’s growth is well below average.
- Maybe your chief marketing officer spent a lot of money on a national campaign to drive brand awareness. How much of that 5.2% growth was generated from that campaign, and was that campaign a good value for the money?
- Maybe your CEO appeared on Good Morning America, or your product was featured in Techcrunch, or a video went viral, and that was the driver. That is, growth can be traced back to a specific unusual driving event (which might drive transient or sustained growth).
- Maybe monthly sales are low in volume and highly variable. Maybe that growth was just luck and maybe the overall trend is downward. (If you have ever traded stocks, you will surely understand.)
- Maybe the data is just wrong. If your sales are relatively stable, and you see a spike, and you are not aware of any unusual events, perhaps there is a data quality problem.
All of these are possibilities. The reported number is just that, a numerical value with little to no context.
“As orgs grow larger and complex, people at the top depend less on firsthand experience, and more on heavily processed data.” — John Gardner
John Maeda (@johnmaeda) August 16, 2014
Alerting
Ding, ding, ding! Web-app server #14 has just averaged more than 98% CPU utilization for the last five minutes.
Alerts are essentially reports about what is happening right now. They typically provide very specific data with well-designed metrics. But like reports, they don’t tell you why you are seeing a spike in CPU utilization, and they don’t tell you what to do, right now, to rectify the problem. As such, like reports, they lack this crucial context. There is no causal explanation. This is the point at which performance engineers or system administrators dive into the production logs to ascertain what is going on, why it is happening, and what the options are to fixing it: rollback some code, spin up some more servers, reconfigure the load balancer, etc.
Figure 1-2 shows an example of server load over time. There is some variability, but most of the day is spent with a run queue of about 0.5 or fewer. At 1 a.m., load starts to spike, shooting up to more than 5, a tenfold increase over “normal," in the space of 30 minutes. It seems highly unusual. What’s going on? Maybe someone should fix that, but how?
In this case, it is just the weekly backups running. This happens every Thursday at 1 a.m.—perfectly normal, nothing to see here. This makes the point that there is great data here and a good metric that’s presented clearly. But the context—that it is caused by backups, that it happens on a particular schedule and this 1 a.m. time slot is expected, and that the server can handle this load without problems—is all lacking.
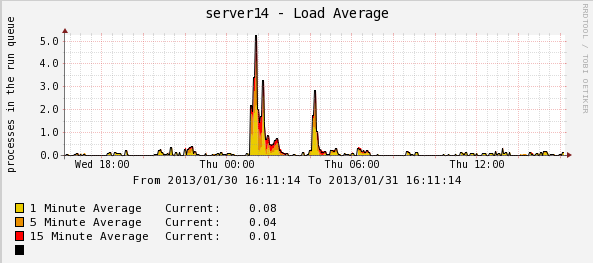
Figure 1-2. Example of server load over time (from http://bit.ly/bwf-back).
From Reporting and Alerting to Analysis
Reporting and alerting are necessary but not sufficient characteristics of being data-driven. We should, however, not understate the importance of both these activities. Reporting especially is a highly valuable component of a data-driven organization. You can’t have an effective one without it. However, the reverse is not true: there are many organizations that focus on reporting and may have little to no real (objective) analysis. For one thing, reporting may be driven by legal requirement and responsibilities, such as Sarbanes-Oxley compliance and generating earnings reports to shareholders, and not from an internal cultural drive to improve the business.
Reporting tells you what happened in the past. It also provides a baseline from which to observe changes and trends. It can be interesting and can keep some investors and shareholders happy, but it is a fundamentally backward view of the world. To be data-driven, you have to go beyond that. To be forward-looking and engage in analysis, dig in, and find out why the numbers are changing and, where appropriate, make testable predictions or run experiments to gather more data that will shed light on why.
Let’s be more explicit and compare and contrast the two. Here is one set of definitions:
- Reporting
-
“The process of organizing data into informational summaries in order to monitor how different areas of a business are performing”1
- Analysis
-
“Transforming data assets into competitive insights that will drive business decisions and actions using people, processes and technologies”2
Reporting says what happened—we hit a peak of 63,000 simultaneous visitors on the website on Thursday at 10:03 a.m. It tends to provide a very specific scope.
Analysis says why it happened—the company was mentioned in a piece on the TV newsmagazine show 60 Minutes at 10:01 a.m.—and should recommend what the organization can or should do to generate more or less of the same.
Reporting is matter of fact, descriptive. Analysis, on the other hand, is prescriptive.
In Table 1-1, we summarize the differences between the two. Hopefully it is now clear why analysis and being data-driven is such a powerful facet or cultural component of a business. This is what can drive a business in new directions or to greater levels of efficiency.
| Reporting | Analysis |
|---|---|
| Descriptive | Prescriptive |
| What? | Why? |
| Backward-looking | Forward-looking |
| Raise questions | Answer questions |
| Data → information | Data + information → insights |
| Reports, dashboards, alerts | Findings, recommendations, predictions |
| No context | Context + storytelling |
A useful framework for understanding analytics is Davenport et al.3 (see Table 1-2).
| Past | Present | Future | |
|---|---|---|---|
| Information |
A) What happened? Reporting |
B) What is happening now? Alerts |
C) What will happen? Extrapolation |
| Insight |
D) How and why did it happen? Modeling, experimental design |
E) What’s the next best action? Recommendation |
F) What’s the best/worst that can happen? Prediction, optimization, simulation |
Here we can see insight-driving activities in the bottom row. As I noted earlier, reporting (A) and alerting (B) are simply not data-driven: they state what happened in the past or that something unusual or undesirable is happening now; there is no explanation of why it is happening or why it did happen, and no recommendations as how to resolve or reproduce the situation. Digging down to understand causal factors through models or experiments (D) is a precursor to data-drivenness. Only by understanding why something happened can you formulate a plan or set of recommendations (E). E) and F) are truly data-driven but if and only if the information is acted upon—explained in detail below.
(C is a danger zone: it can be easy enough to extend a perceived trend out to the future—in Excel, click “Chart" and then “Add trendline”—that is, extrapolate outside the current’s data range and make a naïve prediction. Even making a sensible choice about a functional form for the model, there are many reasons why that prediction may be misleading or plain wrong. To have confidence in those predictions, you should strive to have a causal model. Types of analysis is covered in Chapter 5.)
In summary, the bottom row highlights forward-looking activities that include elements of causal explanation. Now we are starting to touch upon what it means to be data-driven.
Hallmarks of Data-Drivenness
There are several types of activities that truly data-driven organizations engage in:
- A data-driven organization may be continuously testing. It might be A/B testing checkout flow on a website or testing email subject lines in a marketing campaign. LinkedIn, for instance, runs 200 experiments per day, whereas Etsy runs dozens of experiments simultaneously. Tests may also include user testing—working directly with actual customers or users to obtain direct feedback on possible new features or products.
- A data-driven organization may have a continuous improvement mindset. It may be involved in repeated optimization of core processes, such as shaving minutes off manufacturing times or decreasing cost per acquisition. This comes about through careful analysis, crafting mathematical or statistical models, and simulation.
- A data-driven organization may be involved in predictive modeling, forecasting sales, stock prices, or company revenue, but importantly feeding the prediction errors and other learning back into the models to help improve them (we cover this further in Chapter 10).
- A data-driven organization will almost certainly be choosing among future options or actions using a suite of weighted variables. Resources are always finite, and there are always pros and cons for different reasonable courses of action. One should gather data for each of the set of variables that are of concern or interest and determine weights among those to generate a final leading decision. For instance, when Warby Parker selected its first office location outside New York, it considered a large set of variables—Gallup’s Well-being index, talent pool, cost of living, number and cost of flights to New York, etc.—and ranked and weighted them as part of the final decision. Marissa Mayer (CEO of Yahoo!) tells a similar story when choosing among competing job offers and making her decision to work for Google.4
A true data-driven organization will be doing at least one of these things, something forward-looking where data is a first-class citizen.
OK, now we have an organization that has high-quality data and skilled analysts who are engaged in these forward-looking activities. Surely, that makes it data-driven!
Unfortunately, not necessarily. Like a tree falling in a forest with no one to hear it, if analysts are putting out analyses but no one takes notice, if they don’t influence decision makers’ decisions, which are still based on gut and opinion, it is not data-driven. Analytics has to inform and influence the influencers.
Dykes talks about this in terms of an “analytics value chain” (see Figure 1-3). Data has to drive reports, which should lead to deeper dives and analysis. Those analyses have to get to the decision maker who incorporates those into her decision-making process. This step is key to being data-driven. An organization needs that data and that analysis to drive a decision that changes strategy or tactics and makes an ultimate impact to the organization in some manner. Technology and training can do the first part: enable analysts to run analyses and write up their findings. However, it is the culture that sets up the mindset and process to take notice of those findings, trust them, and act upon them.
Finally, we get to the crux of what being data-driven means. A data-driven organization will use the data as critical evidence to help inform and influence strategy. There will be an evidence-based culture in which data can be trusted and the analysis is highly relevant, informative, and used to determine next steps.
Therein lies the challenge. If your organization is making gut decisions, how do you make a case for more data-driven decision making? It is not easy and it is not quick, so don’t expect radical changes overnight, but everyone in an organization can contribute significantly to such an improvement. In this book, we will examine a number of ways an organization’s culture should be driving to be more data-driven.
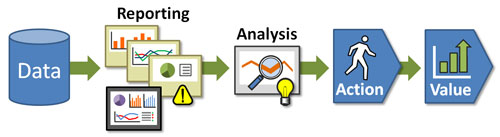
Figure 1-3. The analytics value chain (from Dykes, 2010). In a data-driven organization, the data feed reports, which stimulate deeper analysis. These are fed up to the decision makers who incorporate them into their decision-making process, influencing the direction that the company takes and providing value and impact. Figure from http://bit.ly/dykes-reporting.
Analytics Maturity
In 2009, Jim Davis, the senior vice president and chief marketing officer of SAS Institute, declared that there are eight levels of analytics:5
- Standard reports
-
What happened? When did it happen? Example: monthly financial reports.
- Ad hoc reports
- Query drill down (or online analytical processing, OLAP)
-
Where exactly is the problem? How do I find the answers? Example: data discovery about types of cell phone users and their calling behavior.
- Alerts
-
When should I react? What actions are needed now? Example: CPU utilization mentioned earlier.
- Statistical analysis
-
Why is this happening? What opportunities am I missing? Example: why are more bank customers refinancing their homes?
- Forecasting
-
What if these trends continue? How much is needed? When will it be needed? Example: retailers can predict demand for products from store to store.
- Predictive modeling
-
What will happen next? How will it affect my business? Example: casinos predict which VIP customers will be more interested in particular vacation packages.
- Optimization
-
How do we do things better? What is the best decision for a complex problem? Example: what is best way to optimize IT infrastructure given multiple, conflicting business and resource constraints?
The ideas appear to form the basis of a figure in Davenport and Harris’s 2007 influential book Competing on Analytics,6 shown here as Figure 1-4.
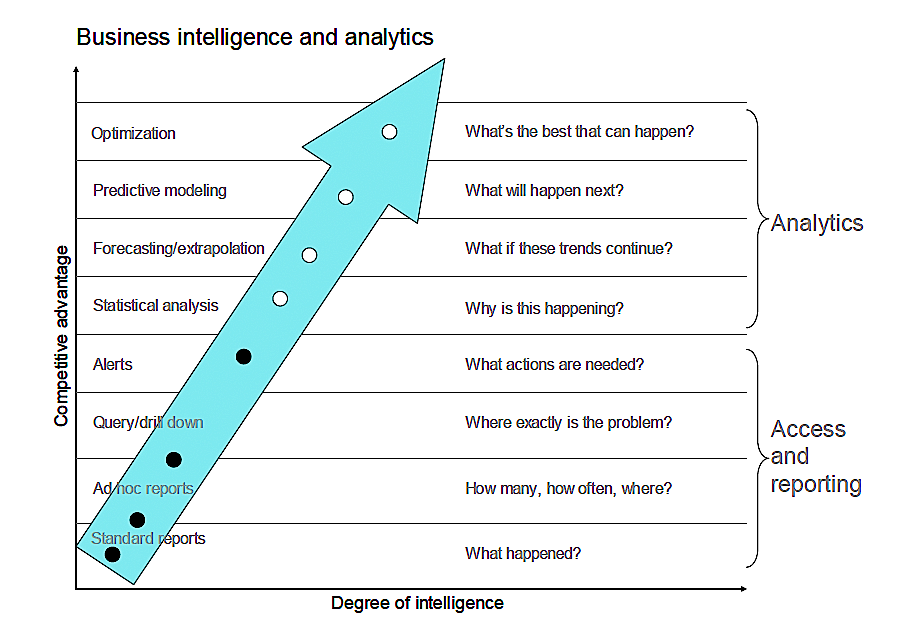
Figure 1-4. “Business Intelligence and Analytics” of Davenport and Harris’ Competing on Analytics. HBR Press, previously derived from Jim Davis’ levels of analytics.
(You can see that this is also where Davenport’s framework and Table 1-2 is based. You can easily map the first four levels to the upper information row and the second set of four to the lower insight row of Table 1-2.)
I like the general concept and the labels. However, in the way that both Davis (2009) and Davenport and Harris (2007) present their ideas, especially with the big sweeping upward arrow, it is too easy to interpret this as a progression or some sort of hierarchy, kind of like a video game where you progress to each next level only after having conquered the previous level.
This pseudo-progression is often labeled as analytics maturity. If you do a Google image search for “analytics maturity,” you will see what I mean; that many BI vendors and practitioners present this as set of stepping stones with unidirectional arrows pointing from one level to the next. Analytics is not like that: it cuts across levels within an analysis, and different parts of the organization can be engaged in analyses of differing degrees of sophistication at any one time. Ron Shevlin7 makes some great points:
From a capabilities perspective, there’s no reason why a firm couldn’t forecast something likes sales (“level” 6) without knowing where exactly the “problem” with sales is (“level” 3)...How could I, as a manager, address the question of “what actions are needed now?” without some understanding of “what if these trends continue?” and “what will happen next?” (“levels” 6 and 7)?
The correct way, I think, to interpret this is to think of the maximum level that the organization is engaged in is positively correlated with the level of commitment, investment, and utility of analytics and, as Davenport and Harris argue, the analytical competitiveness. For instance, if you have an operations research team of Ph.D.s dedicated to optimizing your global supply chain, you are clearly heavily invested in data and analytics. If your organization only gets to alerts and query drilldowns, you have a lower investment and are less data-driven.
The underlying implication is that more sophisticated analytics are better; they make and organization more competitive. Is that true? In a fascinating study,8 MIT Sloan Management Review collaborated with IBM Institute for Business Value to survey 3,000 managers and analysts across 30 industries about their use of and beliefs about the value of analytics.
One survey question asked about the organization’s competitive position where the possible responses were:
- Substantially outperform industry peers
- Somewhat outperforming industry peers
- On par with industry peers
- Somewhat or substantially underperforming industry peers
Those organizations that chose answers 1 or 4 were deemed top and lower performers, respectively. Interestingly, compared to lower performers, top performers were:
- Five times more likely to use analytics
- Three times more likely to be sophisticated analytics users
- Two times more likely to use analytics to guide day-to-day operations
- Two times more likely to use analytics to guide future strategies
There are certainly complicating factors in the methodology. There may be significant survivor bias, and there will likely be correlation of top performers with organization size (we know that revenue of these organizations ranged from less than $500 million to more than $10 billion). For instance, perhaps only larger, more successful organizations have the bandwidth and resources to develop sophisticated operations research departments that can develop and run supply chain simulation models. However, there was broad agreement that better and more sophisticated analytics drove business value.
The authors identified three levels of analytics capability: aspirational, experienced, and transformed. These are summarized in Table 1-3.
| Aspirational | Experienced | Transformed | |
|---|---|---|---|
| Use analytics to... | Justify actions | Guide actions | Prescribe actions |
| Use rigorous approaches to make decisions | Rarely | Sometimes | Mostly |
| Ability to capture, aggregate, and analyze or share information and insights | Limited | Moderate | High |
| Functional proficiency |
|
|
|
Compared to aspirational organizations, transformed organizations were:
- Four times more likely to capture information very well
- Nine times more likely to aggregate information very well
- Eight times more likely to analyze information very well
- Ten times more likely to disseminate information and insights very well
- 63% more likely to use a centralized analytics unit as the primary source of analytics (analytics organizational structures are covered in Chapter 4)
Again, there is a complicated tangle of cause and effect and biases here, but there is an association between competitive advantage, relative to industry peers, and analytics sophistication.
So, what is stopping organizations from adopting analytics widely? Two of the top three answers were lack of understanding of how to use analytics and lack of skills internally in the line of business (see Figure 1-5).

Figure 1-5. Response to the question, “What are the primary obstacles to widespread adoption and use of information and analytics in your organization?”
Those are something that everyone, including every analyst, can help drive. For instance, analysts can help “level up” their skill set and can be more proactive about doing good work and communicating its value to their managers and to the business. They can do more research to dig up case studies of how other organizations tackled similar business problems through analytics. Managers of the data engineers can assign resource to data integration and quality so that data is trusted. Senior managers can promote or demand greater sharing of data and designate clearer ownership and stewardship of data, such as appointing a chief analytics officer or chief data officer (covered in Chapter 11). Everyone has a role.
Overview
We’ll dive into these issues in more detail in the following chapters. More concretely, I’ll examine the needs in terms the foundation: the raw and aggregated data itself and its quality (Chapters 2 and 3). Next, I’ll examine the analyst organization itself: the types of analysts, the skills they should possess, and how they should be structured (Chapter 4). I’ll cover aspects of data analysis (Chapter 5), metric design (Chapter 6), and storytelling with data (Chapter 7). Chapter 8 covers A/B testing. Crucially, we’ll cover the culture and decision-making process that are the hallmarks of a great data-driven organization (Chapters 9 and 10). I’ll discuss what’s needed to manage the culture and change management, especially in larger organizations: a data-driven C-suite. In particular, I’ll cover three new executive positions: chief data officer, chief digital officer, and chief analytics officer (Chapter 11). Chapter 12 covers ethics and privacy issues of data and how an organization that respects its users’ data may in fact limit what its analysts may do with the data. I’ll end with some general conclusions (Chapter 13).
1 Dykes, B., “Reporting vs. Analysis: What’s the Difference?” Digital Marketing Blog, October 19, 2010.
2 Faria, M., “Acting on Analytics: How to Build a Data-Driven Enterprise.” BrightTALK, September 11, 2013.
3 Davenport, T.H., J. G. Harris, and R. Morison. Competing on Analytics. Boston: Harvard Business Press, 2010.
4 Bosker, B., “Google Exec Marissa Mayer Explains Why There Aren’t More Girl Geeks.” The Huffington Post, July 6, 2011.
5 SAS, “Eight Levels of Analytics,” (Cary, NC: SAS Institute, Inc., 2008), 4.
6 Despite appearing two years earlier, Davenport and Harris’ source is cited as “adapted from a graphic produced by SAS.”
7 Shevlin, R., “The Eight Levels Of Analytics?” The Financial Brand, October 27, 2009.
8 LaValle, S., M. S. Hopkins, E. Lesser, R. Shockley, N. Kruschwitz, “Analytics: The New Path to Value.” MIT Sloan Management Review, October 24, 2010.
Get Creating a Data-Driven Organization now with the O’Reilly learning platform.
O’Reilly members experience books, live events, courses curated by job role, and more from O’Reilly and nearly 200 top publishers.

